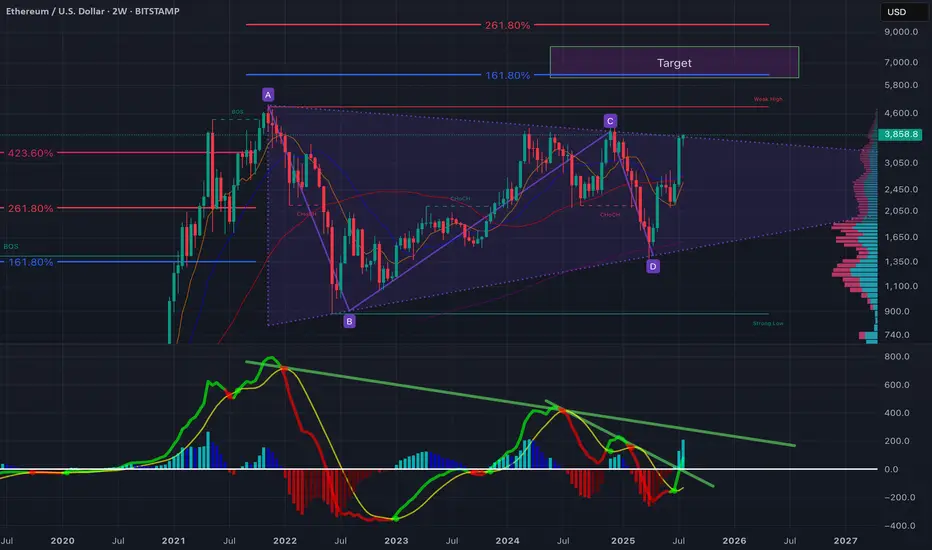
Ethereum is showing a significant breakout setup after years of consolidation within a large symmetrical wedge structure (A–B–C–D pattern). The price has just tested the upper boundary of the wedge, and momentum indicators suggest a potential mid-term bullish continuation.
Key Observations:
ABCD Harmonic Structure: Price has respected the harmonic range with D forming a strong higher low near $1,500–$1,600, showing buyer absorption at key demand levels.
Fibonacci Confluence:
The 161.8% extension aligns with ~$5,800, forming the first major target.
A 261.8% extension pushes towards ~$7,000, aligning with the marked "Target" zone.
Volume Profile: Heavy accumulation between $1,500–$2,500 with low resistance above $4,000 suggests a breakout could accelerate quickly.
MACD/RSI Divergence: The momentum oscillator shows a triple bullish divergence (higher lows on momentum vs. lower lows on price), and the downtrend line on the MACD histogram has been broken—often a precursor to sustained upside.
Moving Averages: The 50/100 EMA crossover on the 2-week chart is imminent, historically a strong macro signal.
Bullish Scenario:
A clear close above $4,000 confirms wedge breakout.
Short-term targets: $4,600 (weak high) and $5,800 (Fib 161.8%).
Macro target: $7,000+ if bullish momentum holds through Q4.
Bearish Risk:
Failure to hold $3,500 could lead to retests of $2,500 or even $2,000 (mid-wedge support).
Watch for macroeconomic shocks (rate cuts, liquidity shifts) which have previously caused retracements in crypto markets.
What’s next?
ETH is approaching a make-or-break moment. If the breakout holds, this could be the start of the next major leg up. A strong weekly close above $4,000–$4,200 is critical for validation.
Disclaimer
The information and publications are not meant to be, and do not constitute, financial, investment, trading, or other types of advice or recommendations supplied or endorsed by TradingView. Read more in the Terms of Use.
Disclaimer
The information and publications are not meant to be, and do not constitute, financial, investment, trading, or other types of advice or recommendations supplied or endorsed by TradingView. Read more in the Terms of Use.