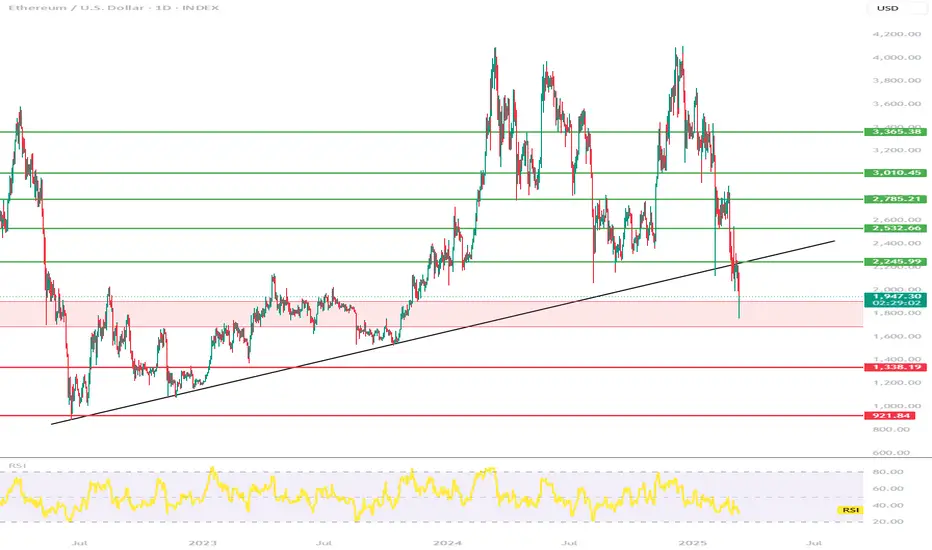
Hey everyone, let's look at the 1D ETH to USD chart, in this situation we can see how the price has reverted back to the long-standing uptrend, and here we can see a significant decline below the uptrend line.
In the event that the trend reverses and growth begins again, it is worth setting targets for the near future that the price must face:
T1 = 2246 USD
T2 = 2533 USD
Т3 = 2785 USD
Т4 = 3010 USD
Т5 = 3365 USD
However, here we can see how the current decline has been maintained by the support zone from $ 1904 to $ 1686, however, if the zone is broken further, we can see a decline to the level of $ 1338, and then again we can have the price go down to the area of $ 921
The RSI indicator shows a continuing downward trend, and here we can see a decline to the lower part of the range, but there is still room for the price to go lower to the lower limit.
Disclaimer
The information and publications are not meant to be, and do not constitute, financial, investment, trading, or other types of advice or recommendations supplied or endorsed by TradingView. Read more in the Terms of Use.
Disclaimer
The information and publications are not meant to be, and do not constitute, financial, investment, trading, or other types of advice or recommendations supplied or endorsed by TradingView. Read more in the Terms of Use.