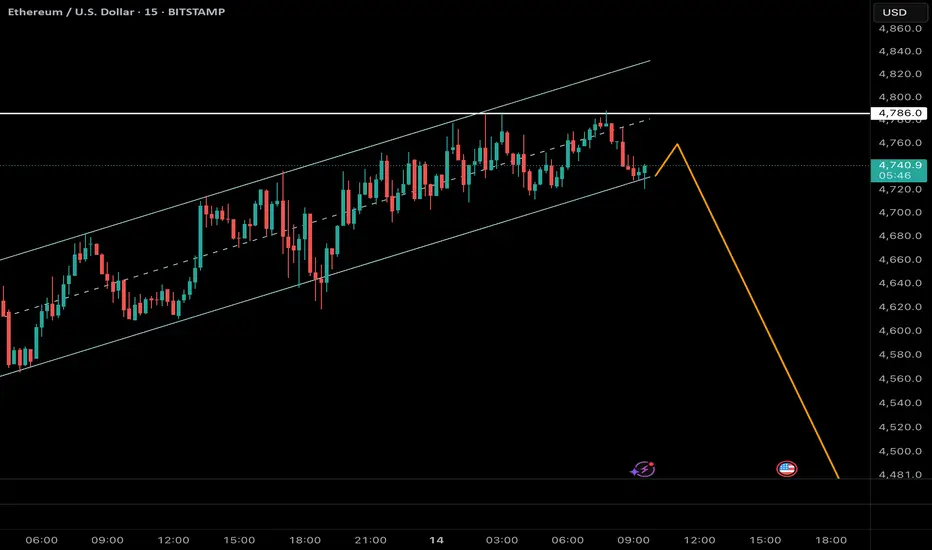
Following yesterday’s analysis, where we identified Ethereum in the final stages of wave 5 of 5 at the upper boundary of its ascending channel, the 15-minute chart now reveals a contracting Neutral Triangle structure. This pattern typically forms as the final subdivision of wave 5, often preceding a sharp and decisive reversal.
Currently, price is testing the upper boundary of the B–D trendline. A confirmed breakdown from the E-wave low (≈ $4,590) would mark the completion of the triangle and signal the start of the anticipated decline.
Key Observations:
• Pattern: Neutral Triangle inside wave 5 of 5 (final stage of advance)
• Reversal Trigger: Break below E-wave low (~$4,590) on strong volume
📊 CryptoPilot – Advanced Technical Analysis for BTC & Altcoins
🔎 Smart Money • Price Action • NeoWave • Multi-Timeframe Context
📩 Contact: @CryptoPilot_1 (Telegram)
📥 Telegram Chanell : @CryptoPilot_Trading
🔎 Smart Money • Price Action • NeoWave • Multi-Timeframe Context
📩 Contact: @CryptoPilot_1 (Telegram)
📥 Telegram Chanell : @CryptoPilot_Trading
Related publications
Disclaimer
The information and publications are not meant to be, and do not constitute, financial, investment, trading, or other types of advice or recommendations supplied or endorsed by TradingView. Read more in the Terms of Use.