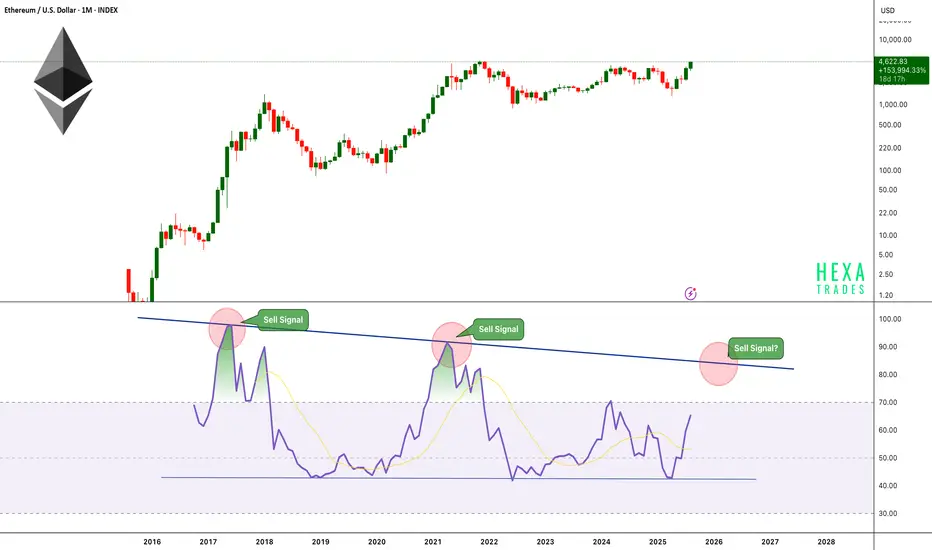
Ethereum is showing strong momentum on the monthly timeframe, pushing toward levels not seen since its previous all-time highs. However, a critical technical indicator, the Monthly RSI is currently at 65 and steadily approaching its historically reliable sell zone between 83–85.
Key Observations:
-The monthly RSI has been capped by a descending trendline resistance since 2017.
-Each time RSI touched this resistance — in 2017 and 2021 — ETH reached a cycle peak, followed by a significant multi-month correction.
-Price is rallying strongly, but RSI still has room to rise before hitting the critical 83–85 zone.
Historical Pattern:
-2017: RSI rejection led to a ~90% decline.
-2021: RSI rejection triggered a ~75% drawdown.
-Now (2025): RSI is climbing toward this zone for the third time, potentially signaling a major profit-taking window once reached.
When the RSI reaches the trend resistance level of 83–85, the price could potentially touch the $7,500–$9,000 range.
Cheers
Hexa
🚀Telegram : t.me/hexatrades
🌐Website: hexatrades.io/
🗣️Twitter(X): twitter.com/HexaTrades
🌐Website: hexatrades.io/
🗣️Twitter(X): twitter.com/HexaTrades
Related publications
Disclaimer
The information and publications are not meant to be, and do not constitute, financial, investment, trading, or other types of advice or recommendations supplied or endorsed by TradingView. Read more in the Terms of Use.