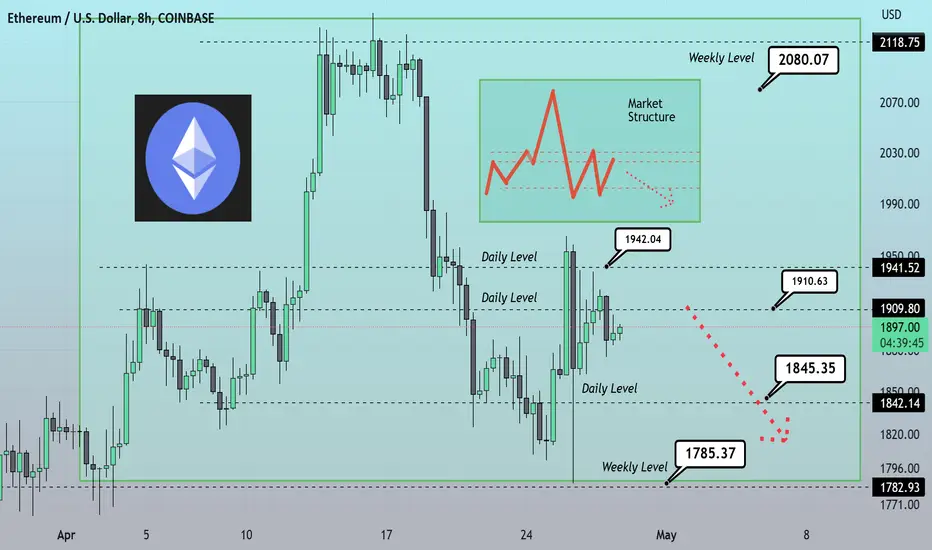
Is this the Bull Run we have all been anticipating? Or Does Price need more time to accumulate above 2018 Highs. Ethereum has been trading in between 1942 Daily Level and 1785 Weekly Level for nearly a Month now. Price has spent 70% of the time inside this range. It spiked to the upside and stayed above the range for a week as some buyers Took Profit and shorts came in to flush out late longs. Price printed an engulfing candle on the Weekly Timeframe as price retreated back into our 1942 to 1785 range. We'll see if this bullish movment can sustain itself.
Note
Price is showing some rejection of our 1910 Daily level. 4Hr candle failing to close above and leaving a top wick that is larger than the body of the candle.It is the Weekend. The Pump up from BTC lows last week began on Saturday.
Note
On the 4Hr Here it appears we may have printed a Hanging Man Candle. Time will tell as we appear to be rejecting 1910 Daily Level on Lower timeframes here.Note
We can observe the Hanging Man Candle in the Yellow Circle ⬆️Note
Price is Respecting our 1910 Daily level as anticipatedMaybe the Hangman Candle on the 8Hr Timeframe will play out
back to 1845 and Beyond.
Note
Target Reached . Price has returned to the Lows of Structure as anticipated. The Hangman Candle worked.
The Fakeout worked as anticipated. Price wanted to retest 1942
before we headed lower.
Note
ETH Fakeout from 1909, which was from 1.5 Weeks ago is Still Valid. Our target was quite accurate because ETH buyers appears to be holding strongly onto 1842 Daily Level and our 1785 Weekly level. Ethereum's Market Structure is quite interesting inside this larger range. The daily Range we are sitting in currently extedns from 2,000 to 1,842. The Spike up to 2,000 makes me think we may see lower prices from here in the short-medium term That price 2,000 was not sustained for long at all. Note
If 1842 Daily Level & 1785 Weekly Level doesn't hold, then we may see 1715 Daily level rather quickly. For bulls we really want these level's to hold to maintain Bullish Market structure.Related publications
Disclaimer
The information and publications are not meant to be, and do not constitute, financial, investment, trading, or other types of advice or recommendations supplied or endorsed by TradingView. Read more in the Terms of Use.
Related publications
Disclaimer
The information and publications are not meant to be, and do not constitute, financial, investment, trading, or other types of advice or recommendations supplied or endorsed by TradingView. Read more in the Terms of Use.