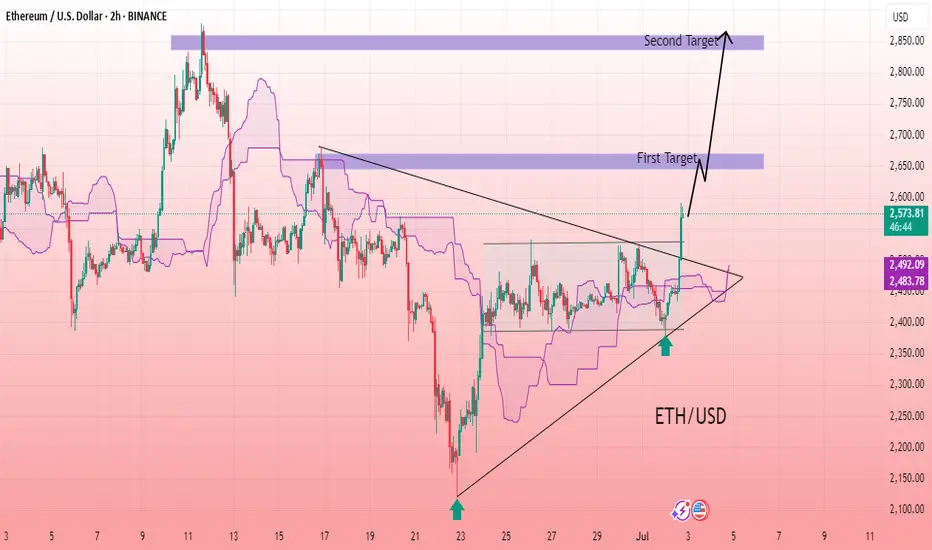
The ETH/USD 2-hour chart reveals a classic ascending triangle formation, which has now been decisively broken to the upside. After consolidating within a tightening range for several sessions, Ethereum has surged past the horizontal resistance level, supported by Ichimoku cloud structure and rising trendline support. The breakout candle is strong, indicating bullish momentum and potential for further upward movement. The breakout aligns with increasing volume and market confidence. This technical setup suggests a possible rally continuation toward higher resistance zones marked above. The structure remains bullish as long as price holds above the breakout zone with minimal retracement.
Entry: 2,570
1st Target: 2660
2nd Target: 2,850
Entry: 2,570
1st Target: 2660
2nd Target: 2,850
Trade active
Join telegram channel free ..
t.me/GoldMan0009
Forex, Gold & Crypto Signals with detailed analysis & get consistent results..
Gold Signal's with proper TP & SL for high profit opportunities..
t.me/GoldMan0009
t.me/GoldMan0009
Forex, Gold & Crypto Signals with detailed analysis & get consistent results..
Gold Signal's with proper TP & SL for high profit opportunities..
t.me/GoldMan0009
Disclaimer
The information and publications are not meant to be, and do not constitute, financial, investment, trading, or other types of advice or recommendations supplied or endorsed by TradingView. Read more in the Terms of Use.