Market Structure and Trend
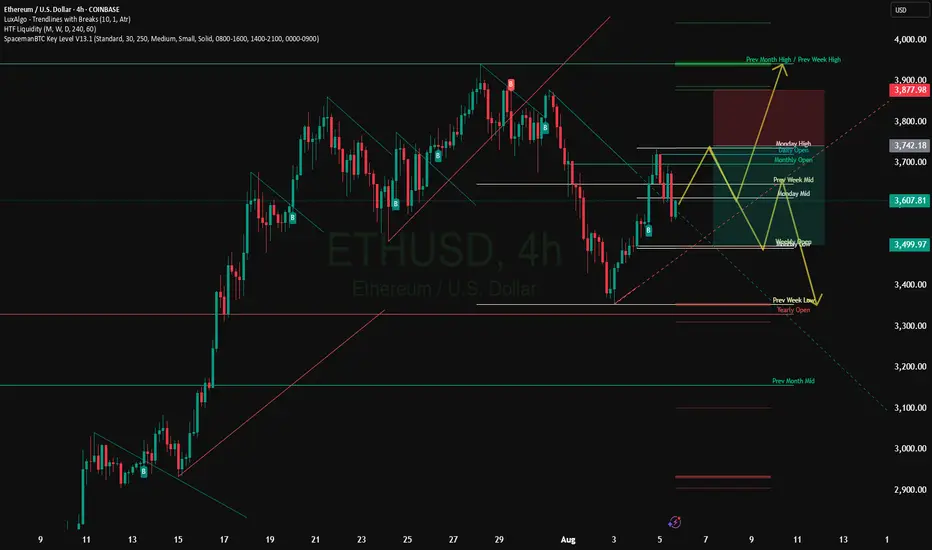
ETH has risen from around $2900 to around $3800 in July, breaking the important $4000 resistance level that has previously failed to be broken three times in 2024
ETH is trading in a tight price range of $3650–$3704, with the price above the EMA(25) ($3460), confirming the medium-term bullish trend
Indicators and Signals
EMA(7): $3739 — price below → short-term weakness signal; but above EMA(25) and EMA(99) (~$2832) → trend remains bullish
Stochastic RSI (6): ~1.6 — oversold level, signaling a possible rebound
RSI (according to TipRanks): around 76.7 — overbought, partially limits growth
ADX (14-day) on Barchart: around 17–23 — weak trend and consolidation
Support and resistance levels
Support:
$3616 — 3650 zone (lower boundary of the range and EMA(25)),
then $3460 (EMA25) and then $3460–$3300 if broken below
Resistance:
$3739 (EMA7),
above $3800,
key level $4000 — psychological and technical barrier,
further — historical maximum around $4800
Possible scenarios
Bulls
If the price holds above $3650 and stochastic RSI bounces up — growth to $3739 → $3780–$3800 is expected.
Breakthrough and holding above $3800 will open the way to $4000–$4100, and potentially higher, up to $4800+ if the market turns in favor of ETH
Bears
Consolidation below $3616 → possible movement to $3460 and lower to $3300+ with increased selling and weak volume
RSI above 70 may foreshadow a correction in the absence of further momentum.
Disclaimer
The information and publications are not meant to be, and do not constitute, financial, investment, trading, or other types of advice or recommendations supplied or endorsed by TradingView. Read more in the Terms of Use.
Disclaimer
The information and publications are not meant to be, and do not constitute, financial, investment, trading, or other types of advice or recommendations supplied or endorsed by TradingView. Read more in the Terms of Use.