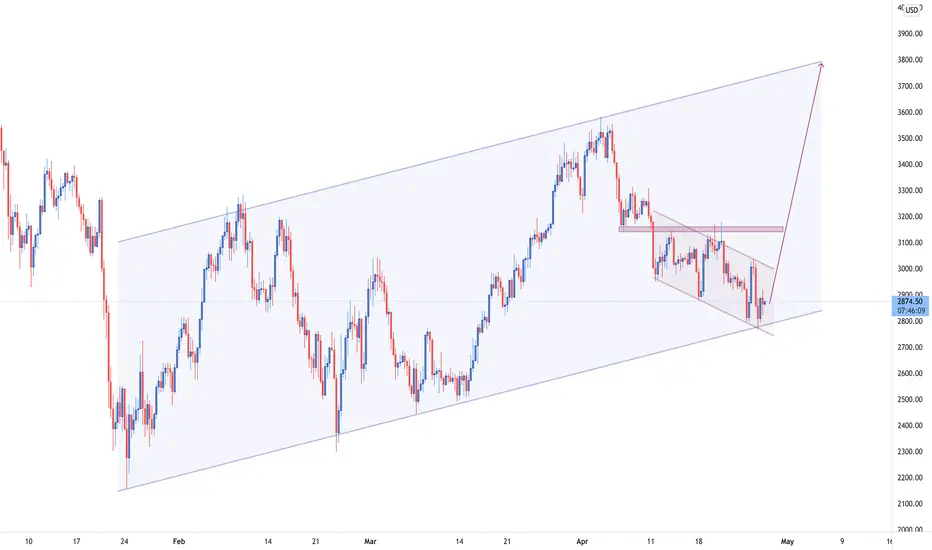
Taking a look at higher timeframe charts, it can be inferred that an ascending channel has been formed and that the price is currently trading at the lower boundary of it. Zooming into lower timeframe charts, we can notice a descending channel and a double bottom formed on the lower barrier of it. We will be closely monitoring the price action and waiting for more confirmations before launching BUY positions and aiming of the zone of the upper boundary as illustrated on the graph.
Disclaimer
The information and publications are not meant to be, and do not constitute, financial, investment, trading, or other types of advice or recommendations supplied or endorsed by TradingView. Read more in the Terms of Use.
Disclaimer
The information and publications are not meant to be, and do not constitute, financial, investment, trading, or other types of advice or recommendations supplied or endorsed by TradingView. Read more in the Terms of Use.