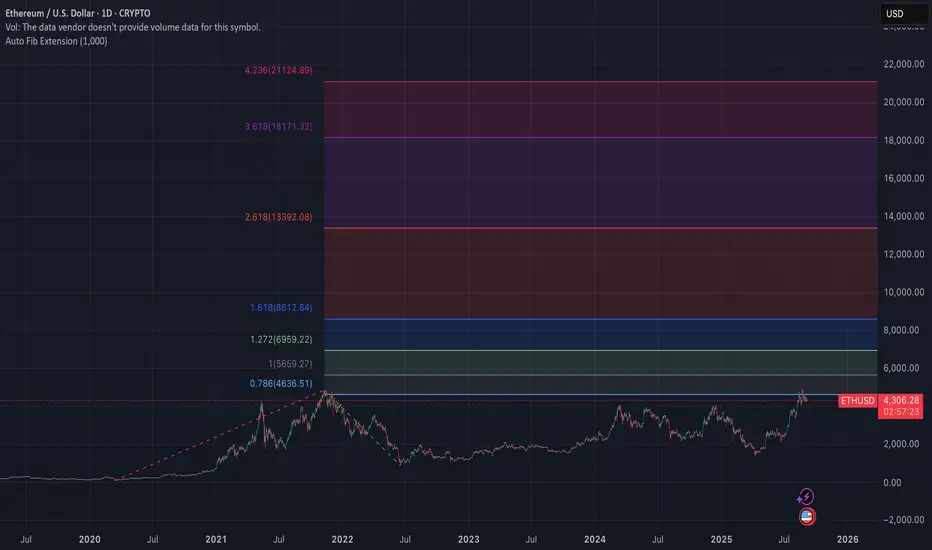
🔎 Key Fibonacci Levels (depth 1000 chart) / Set at 1000 to closely track 4 year cycle
📊 Probabilistic Outlook (based on history + structure)
⚖️ Summary
- 0.618 → $3,839 (recently reclaimed, now support)
- 0.786 → $4,636 (current resistance zone)
- 1.000 → $5,659 (macro breakout confirmation)
- 1.272 → $6,959
- 1.618 → $8,612
- 2.618 → $13,392
- 3.618 → $18,171
- 4.236 → $21,124
📊 Probabilistic Outlook (based on history + structure)
- 0.786 ($4,636): Very close overhead. Odds of testing = 80–90% in this cycle.
- 1.000 ($5,659): Historically tagged in every ETH cycle. Odds = ~85% if bullish structure holds.
- 1.272 ($6,959): Tagged in all past ETH bull cycles. Odds = ~75%.
- 1.618 ($8,612): Historically hit in every run. Odds = ~65%.
- 2.618 ($13,392): Hit in both 2017 and 2021. Odds = ~45% (usually requires euphoric late-cycle blowoff).
- 3.618 ($18,171): Hit in 2/3 historical cycles. Odds = ~25–30%.
- 4.236 ($21,124): Extreme extension, only tagged in strongest cycles. Odds = ~15–20% (basically “mania top” territory).
⚖️ Summary
- High confidence: ETH tests $5.6k–7k (1.0 → 1.272 Fib) this cycle.
- Likely but needs momentum: ETH pushes to $8.6k (1.618 Fib).
- Possible in full mania: $13k (2.618 Fib).
- Euphoric blow-off only: $18k–21k (3.618–4.236).
Disclaimer
The information and publications are not meant to be, and do not constitute, financial, investment, trading, or other types of advice or recommendations supplied or endorsed by TradingView. Read more in the Terms of Use.
Disclaimer
The information and publications are not meant to be, and do not constitute, financial, investment, trading, or other types of advice or recommendations supplied or endorsed by TradingView. Read more in the Terms of Use.