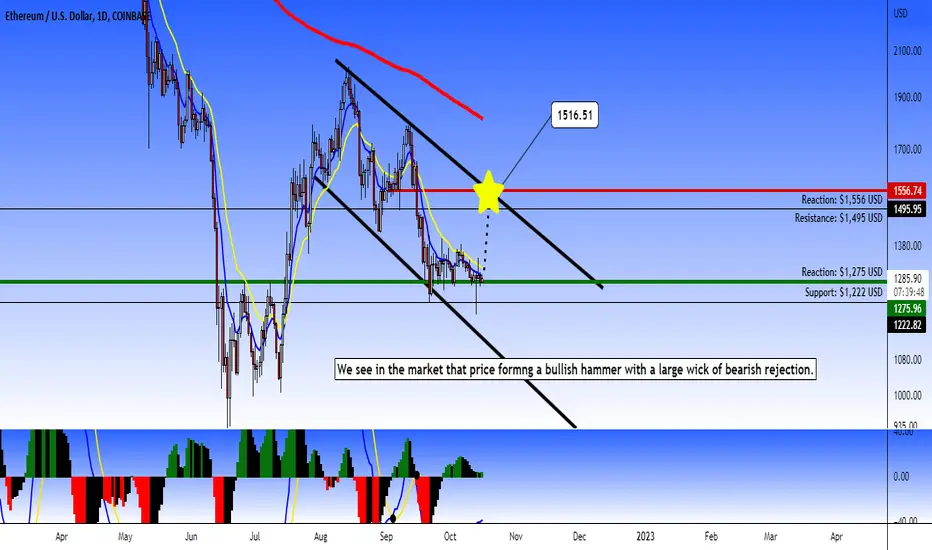
In Daily timeframe, Ethereum look that the price it's into this consolidation, but I see in the candlestick analysis that the price forming a series of bullish pattern, and most recently the bullish hammer with a large wick of bullish rejection, indicating that bulls are interesting to lead the price to the upside.
So, our next target to trade will be like $1,500 USD as maximum to watch and study where's our support and resistance key in this chart.
So guys, I hope that this analsyis support you if you want to trade Ethereum.
Good luck!!!
I will check in H4 timeframe to know and make another analysis.
So, our next target to trade will be like $1,500 USD as maximum to watch and study where's our support and resistance key in this chart.
So guys, I hope that this analsyis support you if you want to trade Ethereum.
Good luck!!!
I will check in H4 timeframe to know and make another analysis.
Related publications
Disclaimer
The information and publications are not meant to be, and do not constitute, financial, investment, trading, or other types of advice or recommendations supplied or endorsed by TradingView. Read more in the Terms of Use.
Related publications
Disclaimer
The information and publications are not meant to be, and do not constitute, financial, investment, trading, or other types of advice or recommendations supplied or endorsed by TradingView. Read more in the Terms of Use.