Hi guys,
Here I give you some key insights on the four-hour chart for ETHUSD.
After being in a bullish market, we are now in an undecisive phase and the next breakout would indicate the direction of the market for few weeks.
Thanks for reading,
Have a nice week
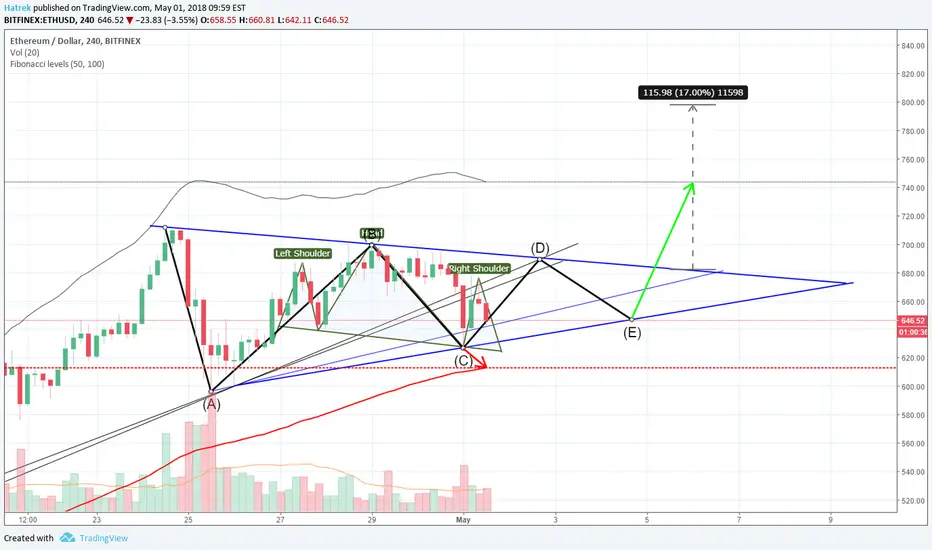
Here I give you some key insights on the four-hour chart for ETHUSD.
- ABCDE Elliot wave symmetrical triangle potential, if it would form, then we have a potential to rise to $800, but the highest support we could test is located at the 6th Fibonacci Up support (grey line) [$745];
- H&S is due to be formed, if it doesn't fail, we could exit the symmetrical triangle and test the middle Fibonacci support (red line) [$612];
After being in a bullish market, we are now in an undecisive phase and the next breakout would indicate the direction of the market for few weeks.
Thanks for reading,
Have a nice week
Note
H&S pattern rejected.
On the hpur-chart, we would test $667 Fibonacci middle support. If it breaks the target is $678 to retest the uptrend support.
That would be confirm if the Adam&Eve double bottom completes.
Note
We have not broken the uptrend support yet, but the A&E double bottom confirmed, we should recover $690 soon.
Disclaimer
The information and publications are not meant to be, and do not constitute, financial, investment, trading, or other types of advice or recommendations supplied or endorsed by TradingView. Read more in the Terms of Use.
Disclaimer
The information and publications are not meant to be, and do not constitute, financial, investment, trading, or other types of advice or recommendations supplied or endorsed by TradingView. Read more in the Terms of Use.