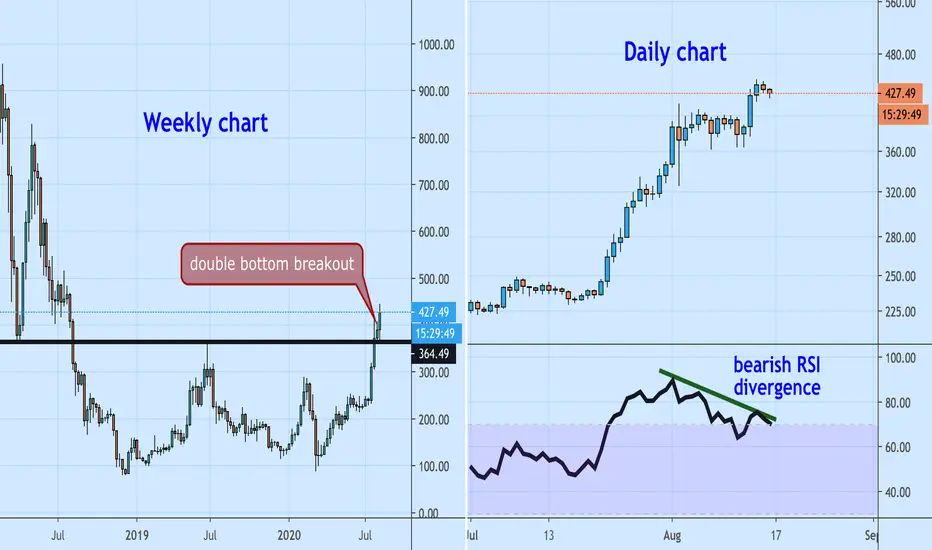
Weekly chart shows a double bottom breakout.
Former resistance of $364 is now key support.
The broader trend looks bullish, but further gains could remain elusive for sometime as the daily chart shows a bearish divergence of the relative strength index.
Former resistance of $364 is now key support.
The broader trend looks bullish, but further gains could remain elusive for sometime as the daily chart shows a bearish divergence of the relative strength index.
Disclaimer
The information and publications are not meant to be, and do not constitute, financial, investment, trading, or other types of advice or recommendations supplied or endorsed by TradingView. Read more in the Terms of Use.
Disclaimer
The information and publications are not meant to be, and do not constitute, financial, investment, trading, or other types of advice or recommendations supplied or endorsed by TradingView. Read more in the Terms of Use.