Ethereum (ETH/USD) Chart Analysis
**Trend Overview:**Ethereum (ETH/USD) Chart Analysis
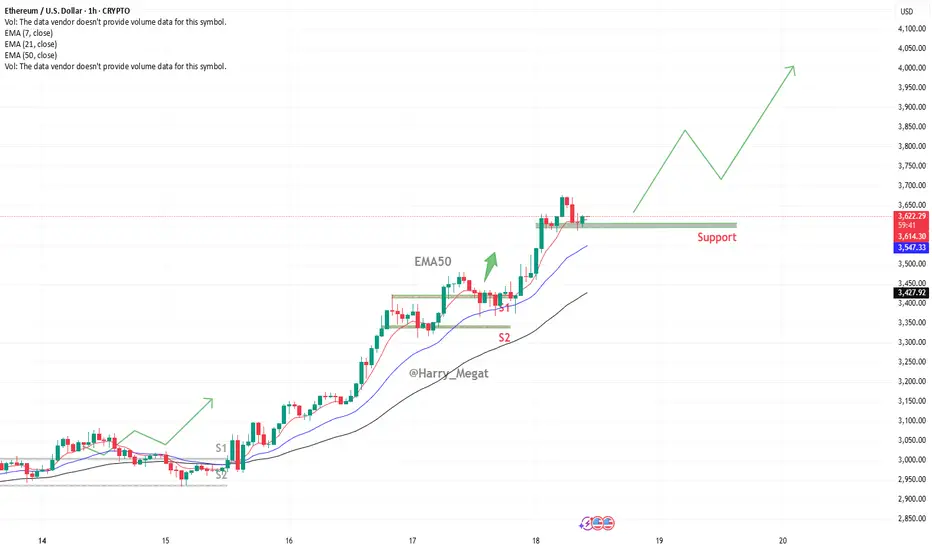
* The chart shows **strong bullish momentum**, with Ethereum maintaining an upward trend of **higher highs and higher lows**.
* The price is currently around **\$3,618**, well above the key moving averages:

* **EMA(7): \$3,610**
* **EMA(21): \$3,539**
* **EMA(50): \$3,419**
**Support Levels:**
* The recent pullback found support at the **\$3,570–\$3,600 zone**, which is now acting as a **key horizontal support**.
* Below this, **EMA 21 (\$3,539)** and **EMA 50 (\$3,419)** offer additional dynamic support zones.
* Marked support areas **S1 and S2** also highlight previous breakout zones that could act as strong demand levels if retested.
**Bullish Outlook:**
* As long as ETH stays **above the support zone**, the bullish trend is likely to continue.
* A bounce from the current level could lead to a **retest of \$3,740**, followed by a move toward the **\$4,000 target** shown by the projected green path on the chart.
**Indicators & Sentiment:**
* Price respecting the EMA lines confirms **strong buyer interest** on pullbacks.
* No visible bearish divergence, and the chart structure favors **trend continuation**.
**Conclusion:**
Ethereum remains in a **bullish structure**, with strong support around \$3,570–\$3,600. As long as it holds above this zone, the next upside targets are \$3,740 and potentially \$4,000. A break below the EMAs would signal weakness, but for now, momentum supports continued gains.
**Trend Overview:**Ethereum (ETH/USD) Chart Analysis
* The chart shows **strong bullish momentum**, with Ethereum maintaining an upward trend of **higher highs and higher lows**.
* The price is currently around **\$3,618**, well above the key moving averages:
* **EMA(7): \$3,610**
* **EMA(21): \$3,539**
* **EMA(50): \$3,419**
**Support Levels:**
* The recent pullback found support at the **\$3,570–\$3,600 zone**, which is now acting as a **key horizontal support**.
* Below this, **EMA 21 (\$3,539)** and **EMA 50 (\$3,419)** offer additional dynamic support zones.
* Marked support areas **S1 and S2** also highlight previous breakout zones that could act as strong demand levels if retested.
**Bullish Outlook:**
* As long as ETH stays **above the support zone**, the bullish trend is likely to continue.
* A bounce from the current level could lead to a **retest of \$3,740**, followed by a move toward the **\$4,000 target** shown by the projected green path on the chart.
**Indicators & Sentiment:**
* Price respecting the EMA lines confirms **strong buyer interest** on pullbacks.
* No visible bearish divergence, and the chart structure favors **trend continuation**.
**Conclusion:**
Ethereum remains in a **bullish structure**, with strong support around \$3,570–\$3,600. As long as it holds above this zone, the next upside targets are \$3,740 and potentially \$4,000. A break below the EMAs would signal weakness, but for now, momentum supports continued gains.
Trade active
✅ **ETH/USD Update – Bullish Scenario Played Out Successfully**Ethereum (ETH) continued its strong bullish momentum and has now **hit \$3,820**, fulfilling the bullish scenario that projected an upward move from the breakout near \$3,470 and \$3,570 levels.
Summary of the Bullish Play:
* ETH broke above the **ascending broadening wedge** and cleared resistance at **\$3,470**, then **\$3,570**.
* Momentum extended as predicted toward **\$3,820**, approaching the **next key zone near \$3,900–\$4,000**.
* The bullish pattern from earlier (symmetrical triangle + bullish pennant) guided the move.
Current Market Conditions:
* **RSI** and **Stochastic** are in or near overbought zones – suggesting potential short-term cooling.
* **Support levels to watch**: \$3,740 / \$3,570 / \$3,470.
* As long as ETH holds above \$3,740, the bullish structure remains intact.
Next Bullish Target:
* If momentum continues, the next major resistance sits around **\$3,950–\$4,000**.
**Conclusion**:
The bullish idea has **run successfully**, and ETH remains in an uptrend with strong buying pressure and bullish technicals.
Trade closed: target reached
Ethereum (ETH/USD) reaching **\$3,850** marks a successful execution of this bullish setup.1. **Analysis:**
ETH had been forming a bullish structure — breaking out of both a **symmetrical triangle** and an **ascending broadening wedge**, signaling a strong upside continuation.
2. **Key Levels Watched:**
* **Breakout Zone:** Around \$3,470
* **Support Area:** \$3,600
* **Target Area:** \$3,850–\$4,000 (based on pattern projections)
3. **Current Price Action:**
ETH rallied past the \$3,600 support and maintained bullish momentum, finally hitting the **\$3,850** mark — which was the **upper target** of the pattern. This confirms strong buying interest and market confidence.
4. **Indicators:**
* RSI and Stochastic previously in overbought zones hinted at strength.
* Price holding above EMAs further supported bullish bias.
**Conclusion:**
The move to \$3,850 confirms the bullish setup was valid and successfully played out. ETH remains bullish **as long as it stays above \$3,600**, with **\$4,000** now acting as the next major upside target.
Disclaimer
The information and publications are not meant to be, and do not constitute, financial, investment, trading, or other types of advice or recommendations supplied or endorsed by TradingView. Read more in the Terms of Use.
Disclaimer
The information and publications are not meant to be, and do not constitute, financial, investment, trading, or other types of advice or recommendations supplied or endorsed by TradingView. Read more in the Terms of Use.