✴️ Ethereum could be more bullish than expected
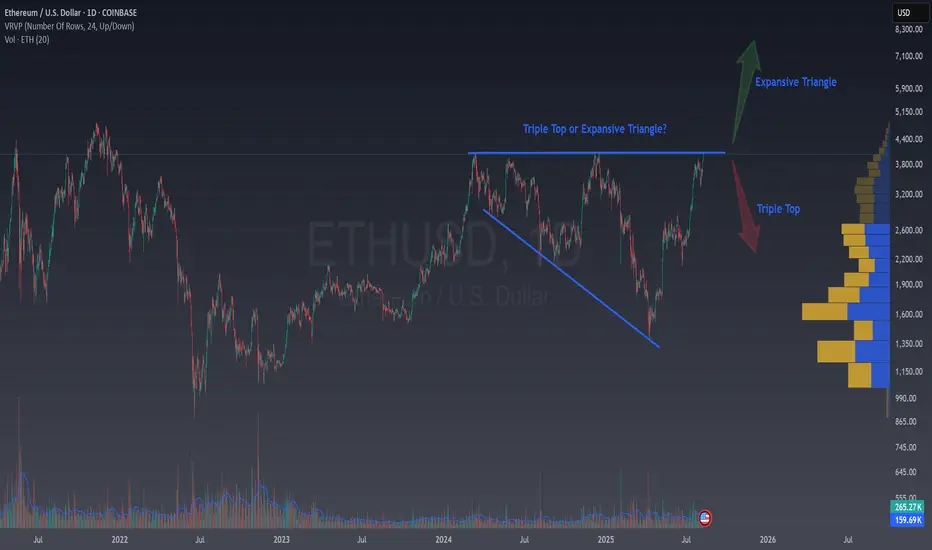
Lately, many traders are pointing at Ethereum’s chart and shouting: “Triple Top!” a classic and easy to spot bearish pattern in technical analysis.
But what if the market is showing us something entirely different?
Zoom in on the structure and you might see an Expanding Triangle (Broadening Formation), a rare but potentially very bullish pattern.
🤔 What Is an Expanding Triangle?
An expanding triangle is formed when both highs and lows keep getting larger, creating a “megaphone” shape on the chart. It's really difficult to spot and is a very rare formation, so it's hard to find ideas on that kind of patterns.
This usually signals:
Expanding triangles act as continuation patterns and in bullish contexts, breakouts to the upside can be explosive.
⭐ Why This Might Be Bullish for ETH
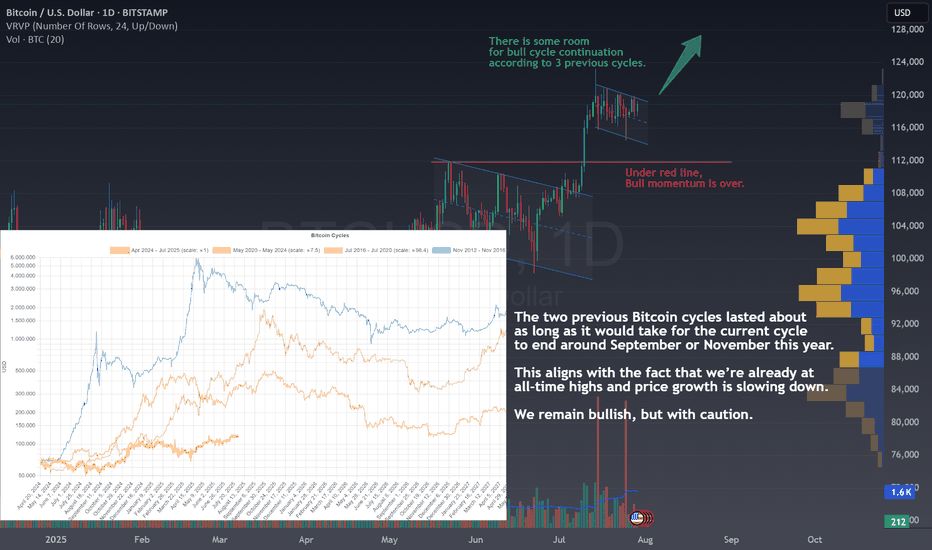
a) Bitcoin Bull Cycle Nearing Its End
Bitcoin often leads the crypto market. Historically, after its major bull peaks (often 18 months after the halving), capital starts rotating out of BTC into other cryptocurrencies.
Several analysts suggest that we are approaching the later stages of Bitcoin’s current cycle and I also spotted that in recent ideas.
b) The Start of Altcoin Season
One of the most common signals for the start of an altseason is a drop in Bitcoin dominance.
When BTC dominance falls under 60%, altcoins tend to outperform dramatically, something we saw in 2017 and again in 2021.

Recently, BTC dominance has been showing signs of topping, which historically precedes strong altcoin rallies.
c) Ethereum’s Position in the Capital Flow
The typical flow of capital in bull markets is often described this way:
Fiat → Bitcoin → Ethereum → Other Altcoins.
If BTC’s run is maturing, Ethereum is historically the next big beneficiary before the wider market joins in.
📈 The Technical Setup
Looking at the chart:
The upper boundary around $4,000 has been tested multiple times.
Each pullback has found higher lows, expanding the price range.
The pattern’s shape fits the definition of an expanding triangle more than a triple top.
A breakout above $4,000–$4,100 with strong volume could confirm the bullish bias and potentially target previous highs near $4,800, or even new all-time highs if market conditions align.
🔥 Bottom Line
While the crowd may be fixated on a triple top, the broader technical and fundamental context hints at a very different story.
An expanding triangle in Ethereum, combined with the nearing end of Bitcoin’s bull cycle and the likely start of altseason, could set the stage for ETH to become the market’s next big mover. However, a healthy pullback before a breakout is perfectly possible, potentially helping the price rise faster later.
If the price fails to break above the $4,100 resistance, a triple top pattern may begin to form. In that case, we should remain cautious on ETH and pay closer attention to short-term price movements.
💬 Does this setup align with your view on ETHUSD?
🚀 Hit the rocket if this helped you spot the opportunity and follow for more easy, educational trade ideas!
Lately, many traders are pointing at Ethereum’s chart and shouting: “Triple Top!” a classic and easy to spot bearish pattern in technical analysis.
But what if the market is showing us something entirely different?
Zoom in on the structure and you might see an Expanding Triangle (Broadening Formation), a rare but potentially very bullish pattern.
🤔 What Is an Expanding Triangle?
An expanding triangle is formed when both highs and lows keep getting larger, creating a “megaphone” shape on the chart. It's really difficult to spot and is a very rare formation, so it's hard to find ideas on that kind of patterns.
This usually signals:
- Rising volatility.
- Increasing participation from both buyers and sellers.
- A potential build-up before a strong breakout.
Expanding triangles act as continuation patterns and in bullish contexts, breakouts to the upside can be explosive.
⭐ Why This Might Be Bullish for ETH
a) Bitcoin Bull Cycle Nearing Its End
Bitcoin often leads the crypto market. Historically, after its major bull peaks (often 18 months after the halving), capital starts rotating out of BTC into other cryptocurrencies.
Several analysts suggest that we are approaching the later stages of Bitcoin’s current cycle and I also spotted that in recent ideas.
b) The Start of Altcoin Season
One of the most common signals for the start of an altseason is a drop in Bitcoin dominance.
When BTC dominance falls under 60%, altcoins tend to outperform dramatically, something we saw in 2017 and again in 2021.
Recently, BTC dominance has been showing signs of topping, which historically precedes strong altcoin rallies.
c) Ethereum’s Position in the Capital Flow
The typical flow of capital in bull markets is often described this way:
Fiat → Bitcoin → Ethereum → Other Altcoins.
If BTC’s run is maturing, Ethereum is historically the next big beneficiary before the wider market joins in.
📈 The Technical Setup
Looking at the chart:
The upper boundary around $4,000 has been tested multiple times.
Each pullback has found higher lows, expanding the price range.
The pattern’s shape fits the definition of an expanding triangle more than a triple top.
A breakout above $4,000–$4,100 with strong volume could confirm the bullish bias and potentially target previous highs near $4,800, or even new all-time highs if market conditions align.
🔥 Bottom Line
While the crowd may be fixated on a triple top, the broader technical and fundamental context hints at a very different story.
An expanding triangle in Ethereum, combined with the nearing end of Bitcoin’s bull cycle and the likely start of altseason, could set the stage for ETH to become the market’s next big mover. However, a healthy pullback before a breakout is perfectly possible, potentially helping the price rise faster later.
If the price fails to break above the $4,100 resistance, a triple top pattern may begin to form. In that case, we should remain cautious on ETH and pay closer attention to short-term price movements.
💬 Does this setup align with your view on
🚀 Hit the rocket if this helped you spot the opportunity and follow for more easy, educational trade ideas!
Disclaimer
The information and publications are not meant to be, and do not constitute, financial, investment, trading, or other types of advice or recommendations supplied or endorsed by TradingView. Read more in the Terms of Use.
Disclaimer
The information and publications are not meant to be, and do not constitute, financial, investment, trading, or other types of advice or recommendations supplied or endorsed by TradingView. Read more in the Terms of Use.