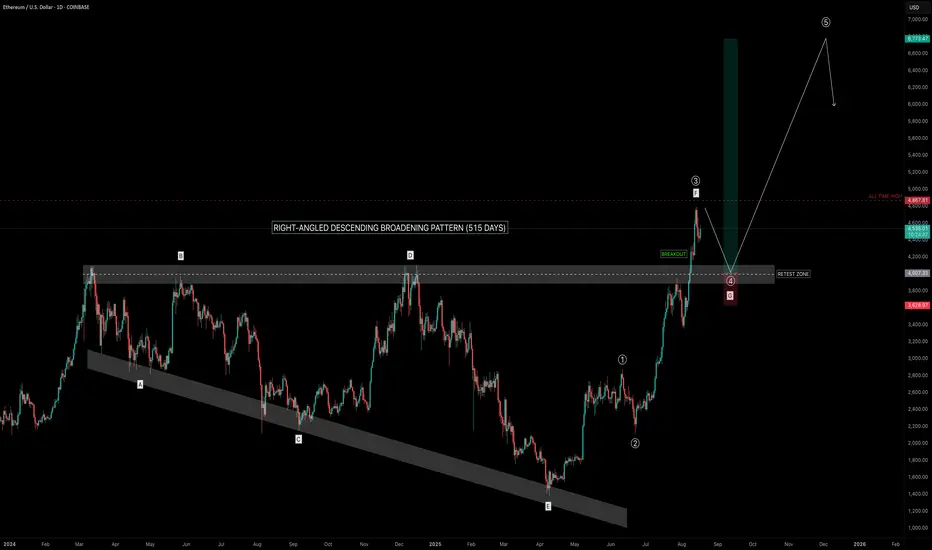
Ethereum (ETH) has completed a Right-Angled Descending Broadening Pattern that developed over a period of 515 days. Such long-term structures are rare and often mark significant turning points in the market.
🔎 Pattern Breakdown
The flat top resistance between $4000–$4100 has already given way. A successful retest and hold above this zone would confirm breakout validity and strengthen the probability of continuation toward ATH and beyond.
Trade Setup View
Why $6800?
The measured move of a broadening formation is its full height projected upward from the breakout point:
➡️ Height = $2725.74
Add that to the breakout zone (~$4100) → $6825. Rounded, that gives a final target of $6800.
💡 Educational Takeaway
Right-Angled Descending Broadening Formations show growing volatility with buyers holding a ceiling steady while sellers run out of steam. Once that flat resistance breaks, momentum usually shifts in favour of the bulls. Since this one lasted over 500 days, the breakout isn’t just noise. It’s a macro signal that could define ETH’s next major trend leg.
Level to Watch Closely:
$4000 → the expected retest (G). Holding here would be a strong confirmation that ETH is ready to aim for ATH and price discovery.
_________________________________
💬 If you found this helpful, drop a like and comment!
🔎 Pattern Breakdown
- A–E → swings inside the broadening formation.
- F → breakout above the flat resistance.
- G (anticipated) → Retest of the breakout zone near $4000, where former resistance may establish itself as support.
The flat top resistance between $4000–$4100 has already given way. A successful retest and hold above this zone would confirm breakout validity and strengthen the probability of continuation toward ATH and beyond.
Trade Setup View
- Retest entry zone (G): ~$4000
- Invalidation (Stop-Loss): To be determined based on price action during the retest
- TP1: Retest of ATH $4867
- TP2: $5390
- Final target (measured move): $6800
- Risk-to-Reward: 1:7+ potential
Why $6800?
The measured move of a broadening formation is its full height projected upward from the breakout point:
- Broadening low: $1383.26
- Broadening high: $4109
➡️ Height = $2725.74
Add that to the breakout zone (~$4100) → $6825. Rounded, that gives a final target of $6800.
💡 Educational Takeaway
Right-Angled Descending Broadening Formations show growing volatility with buyers holding a ceiling steady while sellers run out of steam. Once that flat resistance breaks, momentum usually shifts in favour of the bulls. Since this one lasted over 500 days, the breakout isn’t just noise. It’s a macro signal that could define ETH’s next major trend leg.
Level to Watch Closely:
$4000 → the expected retest (G). Holding here would be a strong confirmation that ETH is ready to aim for ATH and price discovery.
_________________________________
💬 If you found this helpful, drop a like and comment!
Note
ETH Update — RetestAs highlighted in my analysis, I was waiting for a retest of the $4100–$3900 zone and we just got it.
ETH tapped the 0.5 Fib retracement, aligning with both the anchored VWAP and the 21 EMA/SMA (daily TF). This confluence created a clean long opportunity, resulting in a +4% bounce so far, with TP1 hit at the Golden Pocket resistance.
If ETH pulls back again, the $4000 and $3900 levels will be my next areas of interest for long entries.
For now, just observing price action.
Note
GAP FILLED: 🏆 Mastering Fibonacci for precision trading
🔹 Sharing high-probability trade setups
⚡ Unlock the power of technical analysis!
🔹 Sharing high-probability trade setups
⚡ Unlock the power of technical analysis!
Related publications
Disclaimer
The information and publications are not meant to be, and do not constitute, financial, investment, trading, or other types of advice or recommendations supplied or endorsed by TradingView. Read more in the Terms of Use.
🏆 Mastering Fibonacci for precision trading
🔹 Sharing high-probability trade setups
⚡ Unlock the power of technical analysis!
🔹 Sharing high-probability trade setups
⚡ Unlock the power of technical analysis!
Related publications
Disclaimer
The information and publications are not meant to be, and do not constitute, financial, investment, trading, or other types of advice or recommendations supplied or endorsed by TradingView. Read more in the Terms of Use.