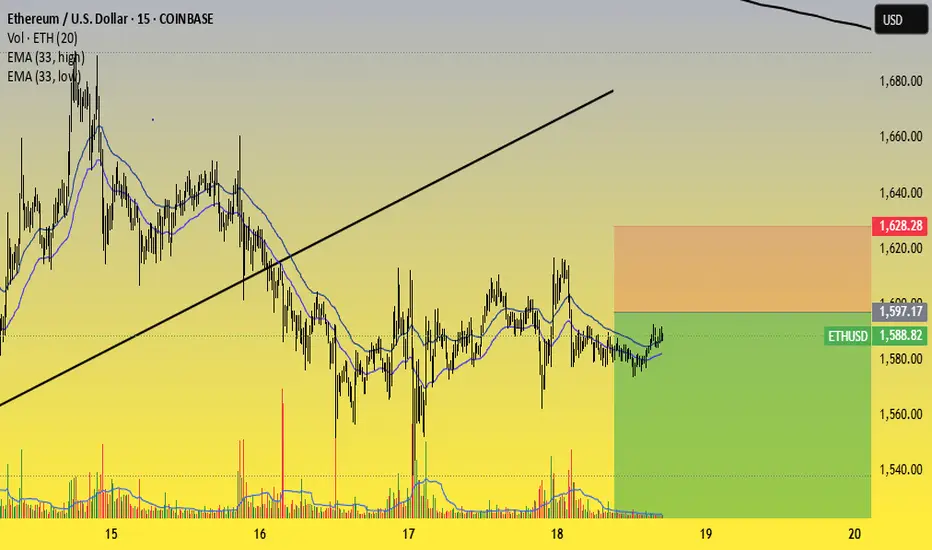
Bearish Plan (Scenario as per the chart):
✅ Phase 1: Breaking support
BTC has broken below the short-term trendline.
Current price is around $84,500 - $84,700.
It is expected to continue falling towards the support zone at $83,250 – $83,000, lying along the longer-term black trendline.
✅ Phase 2: Drop to strong support zone
If selling pressure continues and volume increases (which is currently indicated in the volume chart), BTC could fall further to a stronger support zone:
$82,262 (yellow support line)
$82,107 is the final support level in this scenario.
✅ Phase 3: Potential bounce
After hitting this strong support area, the chart shows a rebound arrow.
BTC may bounce slightly, retesting the $83,000 – $83,500 zone.
3. Chart Implication:
This is a short-term swing trade plan, aiming to capitalize on a strong downward move towards support.
The risk-reward ratio looks favorable with entry around $84,500, take-profit target below $82,500, and stop-loss above $85,000.
4. Conclusion:
The chart outlines a bearish expectation for today (April 18, 2025) and a continuation of the drop into tomorrow morning (April 19, 2025), targeting the $82,100 - $82,300 support zone before a potential bounce.
Related publications
Disclaimer
The information and publications are not meant to be, and do not constitute, financial, investment, trading, or other types of advice or recommendations supplied or endorsed by TradingView. Read more in the Terms of Use.
Related publications
Disclaimer
The information and publications are not meant to be, and do not constitute, financial, investment, trading, or other types of advice or recommendations supplied or endorsed by TradingView. Read more in the Terms of Use.
