Recap
-------
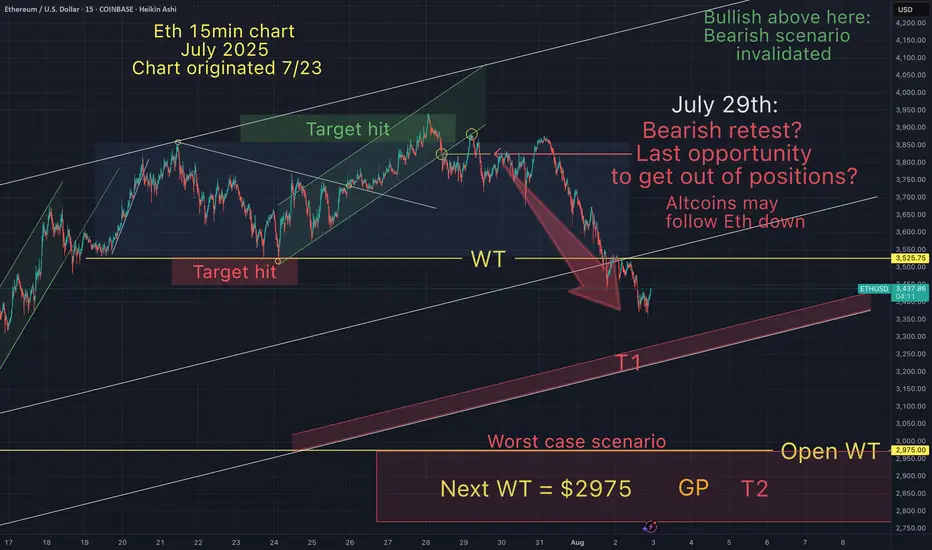
On my July 23rd chart I wrote:
"In a bull market the average retrace is between .2 -.4 Fib from the bottom of that run.
Several factors of confluence lead me to believe Eth will hit my red T1 target, bounce to the top of current range (green T1) then drop to a minimum of .35 Fib = $2990".
On July 28th I wrote:
"As anticipated, my bearish T1 target (red) was hit soon after I first posted this chart on July 23rd 2025.
As the arrow indicated, Eth would bounce from my bearish T1 (red) to my bullish T1 (green). This has been confirmed in both price and in the timeframe indicated by my boxes.
There was also a downward arrow from my green T1 pointing towards my bearish T2 (red). Eth is already retracing from my top target, and I belive it will now continue down the red channel towards T2 and possibly T3 (between $2990 - $3200)".
On July 29th on the chart titled "Has Eth begun it's descent?", I wrote:
"On July 23rd, I anticipated that Eth would dump once it took out the range high.
Now that we have witnessed that, along with a bearish retest (as indicated on chart),
I believe the descent has begun. I hope I'm wrong.
But if I'm right, it will provide me with an amazing entry point around $2900-3200"
Aug 2nd:
Eth has crashed 15%. The descent has begun.
-------
On my July 23rd chart I wrote:
"In a bull market the average retrace is between .2 -.4 Fib from the bottom of that run.
Several factors of confluence lead me to believe Eth will hit my red T1 target, bounce to the top of current range (green T1) then drop to a minimum of .35 Fib = $2990".
On July 28th I wrote:
"As anticipated, my bearish T1 target (red) was hit soon after I first posted this chart on July 23rd 2025.
As the arrow indicated, Eth would bounce from my bearish T1 (red) to my bullish T1 (green). This has been confirmed in both price and in the timeframe indicated by my boxes.
There was also a downward arrow from my green T1 pointing towards my bearish T2 (red). Eth is already retracing from my top target, and I belive it will now continue down the red channel towards T2 and possibly T3 (between $2990 - $3200)".
On July 29th on the chart titled "Has Eth begun it's descent?", I wrote:
"On July 23rd, I anticipated that Eth would dump once it took out the range high.
Now that we have witnessed that, along with a bearish retest (as indicated on chart),
I believe the descent has begun. I hope I'm wrong.
But if I'm right, it will provide me with an amazing entry point around $2900-3200"
Aug 2nd:
Eth has crashed 15%. The descent has begun.
May the trends be with you.
Disclaimer
The information and publications are not meant to be, and do not constitute, financial, investment, trading, or other types of advice or recommendations supplied or endorsed by TradingView. Read more in the Terms of Use.
May the trends be with you.
Disclaimer
The information and publications are not meant to be, and do not constitute, financial, investment, trading, or other types of advice or recommendations supplied or endorsed by TradingView. Read more in the Terms of Use.