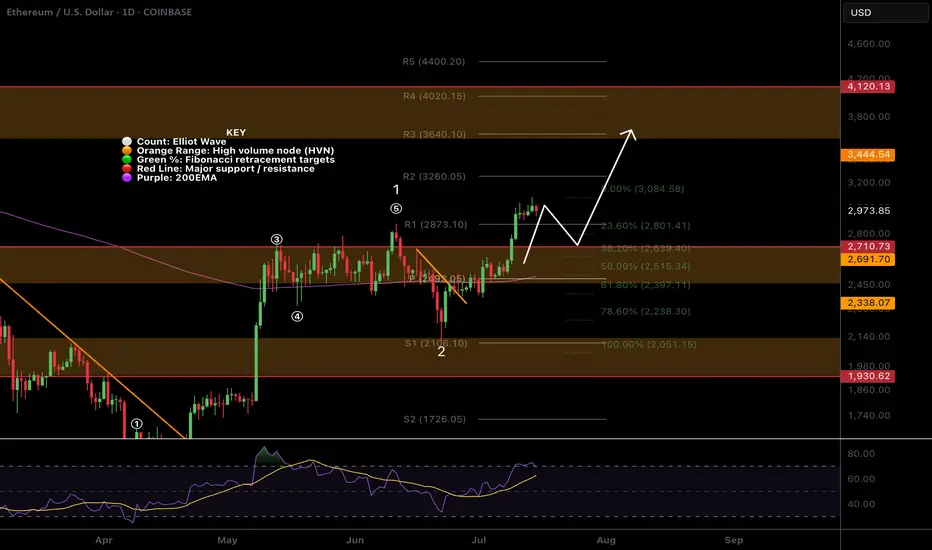
Price is likely to retest the swing high and previous resistance as support around $2600-2700, also the .382 Fibonacci retracement.
RSI is printing daily bearish divergence in overbought from the wave (3) top to current as it did at the wave (5) top seeing large rejection. The retest of $2600 would reset RSI.
Price is ultimately set to test $3600 as the next resistance if the Elliot wave count is correct.
Analysis is invalidated below $2050
Safe trading
MSc Financial Econ
PhD Candidate: Investing & Social Mood
Technical Analyst 7 years
Trader / Investor 14 years
Free DeTrended Metrics Report: detrended.substack.com
Members Only Signals: tradesignals.substack.com
PhD Candidate: Investing & Social Mood
Technical Analyst 7 years
Trader / Investor 14 years
Free DeTrended Metrics Report: detrended.substack.com
Members Only Signals: tradesignals.substack.com
Related publications
Disclaimer
The information and publications are not meant to be, and do not constitute, financial, investment, trading, or other types of advice or recommendations supplied or endorsed by TradingView. Read more in the Terms of Use.