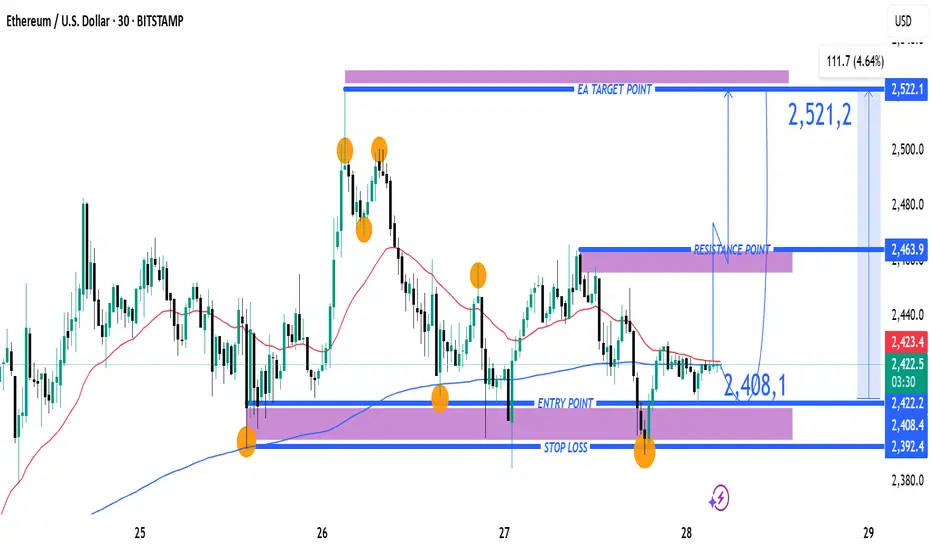
1. Entry Point: ~2,422.2
This is the suggested buy area based on a recent bounce from the support zone
2. Support Zone (Purple Box):
Bottom boundary: ~2,392.4
Top boundary: ~2,408.4
Price has bounced multiple times here, showing strong buying interest.
3. Resistance Point: ~2,463.9
A clear horizontal resistance line, previously tested.
4. EA Target Point: ~2,522.1
A bullish target if the price breaks above the resistance level.
🔶 Highlighted Patterns / Markers
Orange Circles: Indicate key swing highs and lows — possibly used to identify double tops/bottoms or rejection/wick zones.
Blue Arrows: Illustrate the anticipated move from:
Entry (2,408.1) → Resistance (2,463.9) → Target (2,521.2)
Target gain = +111.7 USD (+4.64%)
🔻 Stop Loss Level
Set just below the support box at ~2,392.4
Protects from false breakouts or deeper pullbacks.
📈 Strategy Outlook
Bullish Bias: The setup expects a breakout from the current price range.
Risk-Reward Ratio: Appears favorable — tight stop and wide target.
Confirmation Needed: A solid breakout and hold above 2,423–2,425 may be the early confirmation signal.
📌 Summary
Element Value
Entry Point ~2,422.2
Stop Loss ~2,392.4
Resistance ~2,463.9
Target (TP) ~2,521.2
R:R Ratio Approx. 3:1
Bias Bullish
Trade closed: target reached
Join my telegram (COPY_TRADE)
t.me/TOP1INVEESTADMEN
Join my refrel broker link
one.exnesstrack.org/a/l1t1rf3p6v
t.me/TOP1INVEESTADMEN
Join my refrel broker link
one.exnesstrack.org/a/l1t1rf3p6v
Disclaimer
The information and publications are not meant to be, and do not constitute, financial, investment, trading, or other types of advice or recommendations supplied or endorsed by TradingView. Read more in the Terms of Use.