Hello friends,
Welcome RK_Chaarts.
Today we're attempting to analyze Ethereum's chart from an Elliott Wave perspective. Looking at the monthly timeframe chart, we can see that from the beginning, around 2015-2016, when data is available, to the top in 2021 we have a Super Cycle degree Wave (I) marked in blue, which has completed.
Next, June 2022 we have a bottom around $874, marking the end of Super Cycle Wave (II) in blue.
We are now unfolding Wave (III), which should have five sub-divisions. Within this, the red Cycle degree Wave I and Wave II have completed, and we have possibly started the third of third wave.
Monthly:
Moving to a lower timeframe (Weekly) where we observed the completion of blue Wave (II) and the start of Wave (III), we notice that within this, the red Cycle degree Wave I and Wave II have completed, and we've possibly started Wave III of cycle degree marked in Red.
Furthermore, friends, within this third wave, we've marked the black Primary degree Waves ((1)) and ((2)), which we've labeled as Rounded ((1)) and Rounded ((2)). We're assuming these are complete, and Wave ((3)) has started, which is our current working hypothesis.
Weekly:
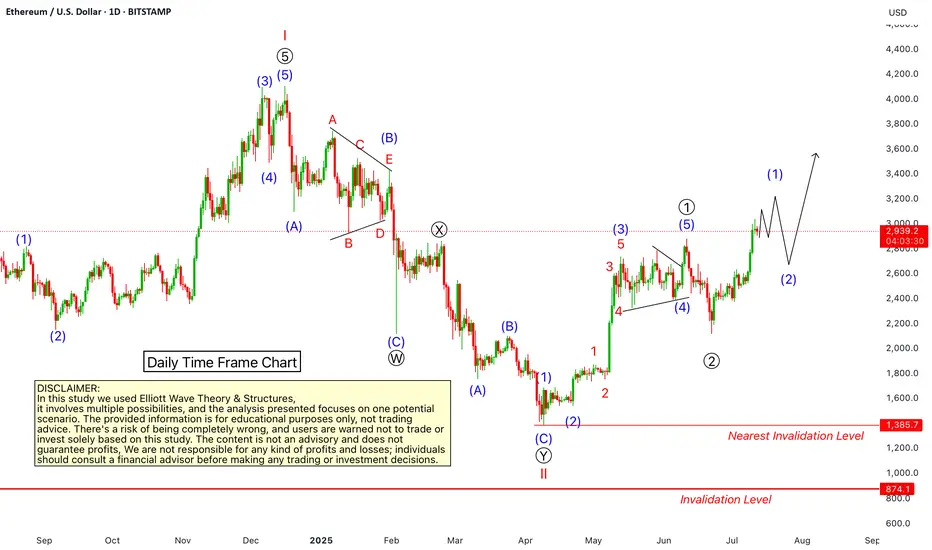
Now, if we move to a lower timeframe, such as the daily chart, we can see that the Cycle degree Wave II, which ended at 1385.70, has been followed by a Primary degree black Wave ((1)) in Black & Wave ((2)) has pulled back, completing Waves ((1)) and ((2)), and now Primary degree Wave ((3)) has started.
Possible wave counts on Daily

Within Wave ((3)), we expect five Intermediate degree waves. We've marked the first Intermediate degree Wave (1) in blue, which is currently unfolding. If we move to an even lower timeframe, such as the 4-hour chart, we can see that within the Intermediate degree blue Wave (1), there are five Minor degree sub-divisions marked in red. Waves 1 and 2 are complete, and Wave 3 is nearing completion.
Possible wave counts on 4 Hours:

Once Wave 3 is complete, we expect Waves 4 and 5 to follow, completing the Intermediate degree blue Wave (1). After that, we may see a dip in the form of Wave (2), followed by a continuation of the bullish trend as blue Wave (3).
Possible wave counts on 60 Min:

Friends, based on our multi-timeframe analysis, the overall wave structure appears bullish. We've provided snapshots of each timeframe, and you can see the nearest invalidation level marked with a red line.
In this study, we're using Elliott Wave theory and structure, which involves multiple possibilities. The scenario we're presenting seems plausible because it's aligned across multiple timeframes and adheres to Elliott Wave principles. However, please remember that this analysis can be wrong, and you should consult with a financial advisor before making any investment decisions.
This post is shared purely for educational purposes, to illustrate possible Elliott Waves.
I am not Sebi registered analyst.
My studies are for educational purpose only.
Please Consult your financial advisor before trading or investing.
I am not responsible for any kinds of your profits and your losses.
Most investors treat trading as a hobby because they have a full-time job doing something else.
However, If you treat trading like a business, it will pay you like a business.
If you treat like a hobby, hobbies don't pay, they cost you...!
Hope this post is helpful to community
Thanks
RK💕
Disclaimer and Risk Warning.
The analysis and discussion provided on in.tradingview.com/u/RK_Chaarts/ is intended for educational purposes only and should not be relied upon for trading decisions. RK_Chaarts is not an investment adviser and the information provided here should not be taken as professional investment advice. Before buying or selling any investments, securities, or precious metals, it is recommended that you conduct your own due diligence. RK_Chaarts does not share in your profits and will not take responsibility for any losses you may incur. So Please Consult your financial advisor before trading or investing.
Welcome RK_Chaarts.
Today we're attempting to analyze Ethereum's chart from an Elliott Wave perspective. Looking at the monthly timeframe chart, we can see that from the beginning, around 2015-2016, when data is available, to the top in 2021 we have a Super Cycle degree Wave (I) marked in blue, which has completed.
Next, June 2022 we have a bottom around $874, marking the end of Super Cycle Wave (II) in blue.
We are now unfolding Wave (III), which should have five sub-divisions. Within this, the red Cycle degree Wave I and Wave II have completed, and we have possibly started the third of third wave.
Monthly:
Moving to a lower timeframe (Weekly) where we observed the completion of blue Wave (II) and the start of Wave (III), we notice that within this, the red Cycle degree Wave I and Wave II have completed, and we've possibly started Wave III of cycle degree marked in Red.
Furthermore, friends, within this third wave, we've marked the black Primary degree Waves ((1)) and ((2)), which we've labeled as Rounded ((1)) and Rounded ((2)). We're assuming these are complete, and Wave ((3)) has started, which is our current working hypothesis.
Weekly:
Now, if we move to a lower timeframe, such as the daily chart, we can see that the Cycle degree Wave II, which ended at 1385.70, has been followed by a Primary degree black Wave ((1)) in Black & Wave ((2)) has pulled back, completing Waves ((1)) and ((2)), and now Primary degree Wave ((3)) has started.
Possible wave counts on Daily
Within Wave ((3)), we expect five Intermediate degree waves. We've marked the first Intermediate degree Wave (1) in blue, which is currently unfolding. If we move to an even lower timeframe, such as the 4-hour chart, we can see that within the Intermediate degree blue Wave (1), there are five Minor degree sub-divisions marked in red. Waves 1 and 2 are complete, and Wave 3 is nearing completion.
Possible wave counts on 4 Hours:
Once Wave 3 is complete, we expect Waves 4 and 5 to follow, completing the Intermediate degree blue Wave (1). After that, we may see a dip in the form of Wave (2), followed by a continuation of the bullish trend as blue Wave (3).
Possible wave counts on 60 Min:
Friends, based on our multi-timeframe analysis, the overall wave structure appears bullish. We've provided snapshots of each timeframe, and you can see the nearest invalidation level marked with a red line.
In this study, we're using Elliott Wave theory and structure, which involves multiple possibilities. The scenario we're presenting seems plausible because it's aligned across multiple timeframes and adheres to Elliott Wave principles. However, please remember that this analysis can be wrong, and you should consult with a financial advisor before making any investment decisions.
This post is shared purely for educational purposes, to illustrate possible Elliott Waves.
I am not Sebi registered analyst.
My studies are for educational purpose only.
Please Consult your financial advisor before trading or investing.
I am not responsible for any kinds of your profits and your losses.
Most investors treat trading as a hobby because they have a full-time job doing something else.
However, If you treat trading like a business, it will pay you like a business.
If you treat like a hobby, hobbies don't pay, they cost you...!
Hope this post is helpful to community
Thanks
RK💕
Disclaimer and Risk Warning.
The analysis and discussion provided on in.tradingview.com/u/RK_Chaarts/ is intended for educational purposes only and should not be relied upon for trading decisions. RK_Chaarts is not an investment adviser and the information provided here should not be taken as professional investment advice. Before buying or selling any investments, securities, or precious metals, it is recommended that you conduct your own due diligence. RK_Chaarts does not share in your profits and will not take responsibility for any losses you may incur. So Please Consult your financial advisor before trading or investing.
YouTube: youtube.com/@rk_charts
Telegram : t.me/RK_Charts
Twitter : @charts_rk
Email : rkcharts@gmail. com
Disclaimer.
I am not sebi registered analyst.
My studies are for educational purpose only.
Telegram : t.me/RK_Charts
Twitter : @charts_rk
Email : rkcharts@gmail. com
Disclaimer.
I am not sebi registered analyst.
My studies are for educational purpose only.
Related publications
Disclaimer
The information and publications are not meant to be, and do not constitute, financial, investment, trading, or other types of advice or recommendations supplied or endorsed by TradingView. Read more in the Terms of Use.