Currently I am still hodling ETH
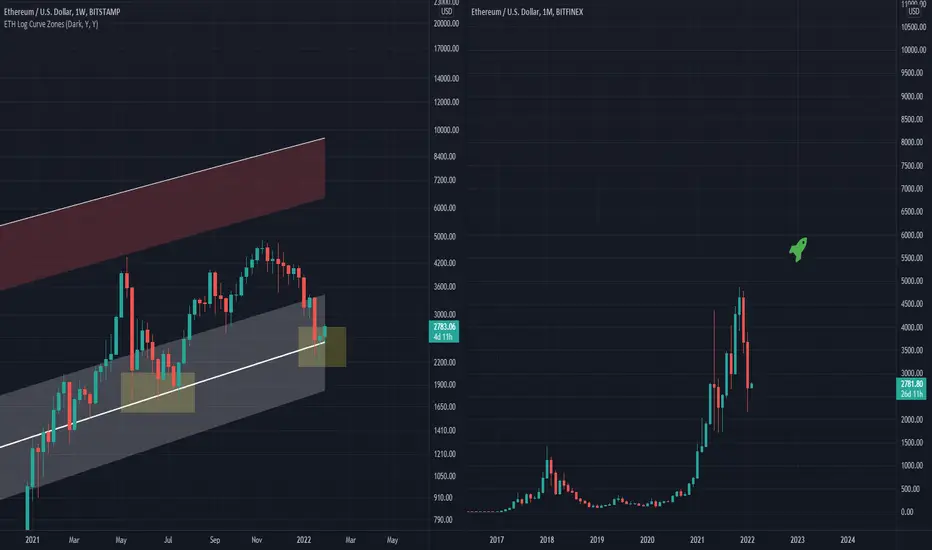
My view on the left side of this chart shows a double bottom along the 50% line of a used indicator.
I have been watching the chart on the right (monthly) for a little bit now and see a preceding small pullback, which "soon" will be followed with a MASSIVE green candle, just completely disregarding this recent dip buy opportunity.
I see ETH going to at least 8 - 10K, perhaps even further.
Disclaimer
The information and publications are not meant to be, and do not constitute, financial, investment, trading, or other types of advice or recommendations supplied or endorsed by TradingView. Read more in the Terms of Use.
Disclaimer
The information and publications are not meant to be, and do not constitute, financial, investment, trading, or other types of advice or recommendations supplied or endorsed by TradingView. Read more in the Terms of Use.