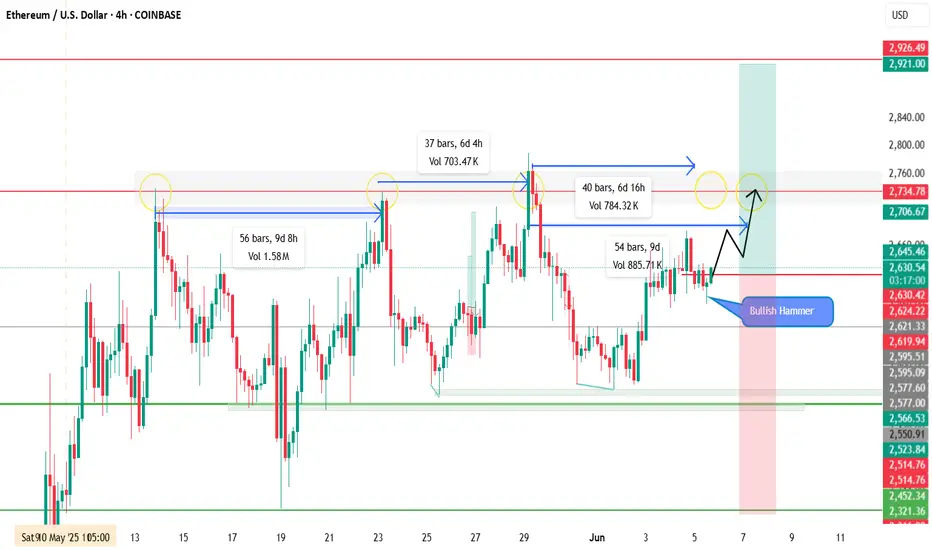
ETH is showing signs of a potential resistance retest, echoing previous price behavior. On the 4H chart, historical data suggests ETH typically revisits resistance zones within 6–9 days (±). The pair has been ranging between support and resistance, and a strong bullish hammer has just formed — signaling a potential shift in momentum.
📍 Entry: Market (Instant)
🛑 Stop Loss: 2312
🎯 Take Profit: 2913 (1:1 Risk-Reward)
📊 Plan: Trade aligned with historical timing and price structure. Entering on bullish confirmation.
⚠️ Note: Manage risk accordingly — structure looks promising, but always respect your stop.
📍 Entry: Market (Instant)
🛑 Stop Loss: 2312
🎯 Take Profit: 2913 (1:1 Risk-Reward)
📊 Plan: Trade aligned with historical timing and price structure. Entering on bullish confirmation.
⚠️ Note: Manage risk accordingly — structure looks promising, but always respect your stop.
Disclaimer
The information and publications are not meant to be, and do not constitute, financial, investment, trading, or other types of advice or recommendations supplied or endorsed by TradingView. Read more in the Terms of Use.
Disclaimer
The information and publications are not meant to be, and do not constitute, financial, investment, trading, or other types of advice or recommendations supplied or endorsed by TradingView. Read more in the Terms of Use.