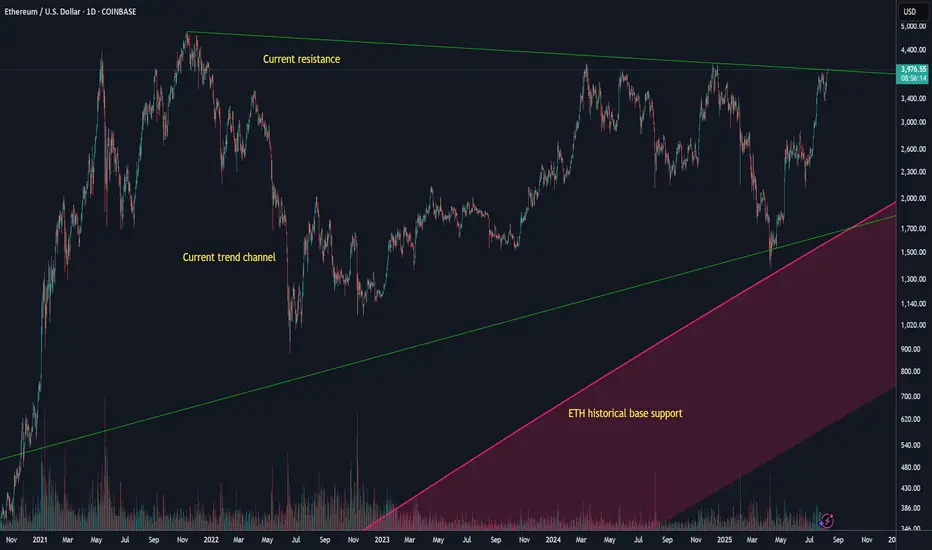
Looking at Ethereum on the daily or weekly Logarithmic chart you can see resistance being consistent since Nov 8th, 2021.
Today, Ethereum has broken through. It was brief, it was fast and it was so small that you can't even see it when zoomed out so far to see the multi year down trend.. However, if you take a look at ETH on the 4hr chart you can see it.
I don't know how ETH will react when breaking such a long downtrend and I look forward to finding out. A retest of the all time high from here seems plausible after such a long downtrend.
Note
Looking at the 5 minute chart. Note
Now ETH needs to print a daily candle closing above the resistance level. If it can, look for a retest back to the 4k level (now as support) then a rise towards the all time high to test that range.Disclaimer
The information and publications are not meant to be, and do not constitute, financial, investment, trading, or other types of advice or recommendations supplied or endorsed by TradingView. Read more in the Terms of Use.
Disclaimer
The information and publications are not meant to be, and do not constitute, financial, investment, trading, or other types of advice or recommendations supplied or endorsed by TradingView. Read more in the Terms of Use.