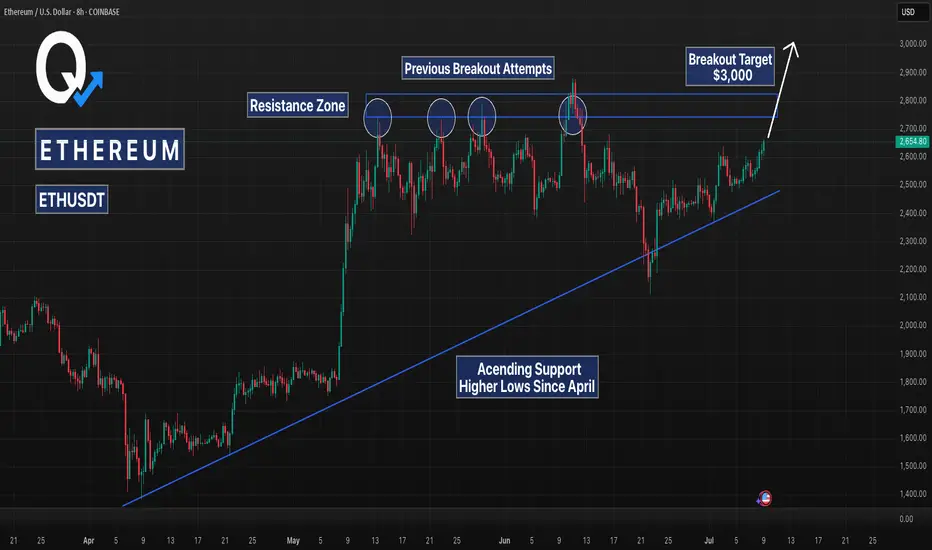
Ethereum has been trading within a large ascending structure since April, forming consistent higher lows while repeatedly testing overhead resistance between $2,730 and $2,850. This is a classic example of a compressed range setup where buyers gradually gain strength beneath a defined ceiling, leading into a potential breakout scenario.
The chart highlights the key structural components of this setup:
An ascending support trendline has been respected for over two months, showing persistent bullish pressure on each dip.
A multi-month resistance zone has capped every breakout attempt since early May, with multiple upper wick rejections confirming this level as major overhead supply.
Most recently, ETH bounced cleanly off the rising trendline again, forming yet another higher low, reinforcing the bullish structure.
If this pattern holds, Ethereum is approaching a technical inflection point. A breakout above $2,850 with strong volume and follow-through could trigger a rapid move toward the $3,000–$3,200 range. That move would align with the measured move from the height of the ascending triangle formation.
However, if price is rejected again from resistance, the ascending trendline remains a key support level to watch for another potential retest. A breakdown below $2,400 would invalidate the pattern and open the door to a deeper retracement.
Key Technical Zones:
Support: Rising trendline from April lows (~$2,400–$2,500)
Resistance: Horizontal zone between $2,730 and $2,850
Breakout Target (on confirmation): $3,000–$3,200
Strategy Notes:
Bias remains bullish while higher lows continue to hold
Breakout setups often benefit from confirmation (candle close above resistance with volume)
Rejections from resistance could offer opportunities to re-enter at trendline support
Try our strategy optimizer at quanttradingpro.com
Developing free strategies weekly stay tuned...
Join our discord discord.gg/2systG9frc
We provide education & tools.
Developing free strategies weekly stay tuned...
Join our discord discord.gg/2systG9frc
We provide education & tools.
Disclaimer
The information and publications are not meant to be, and do not constitute, financial, investment, trading, or other types of advice or recommendations supplied or endorsed by TradingView. Read more in the Terms of Use.