Good evening traders,
Lets take a look on ETHUSD , which is bleeding a lot these days.
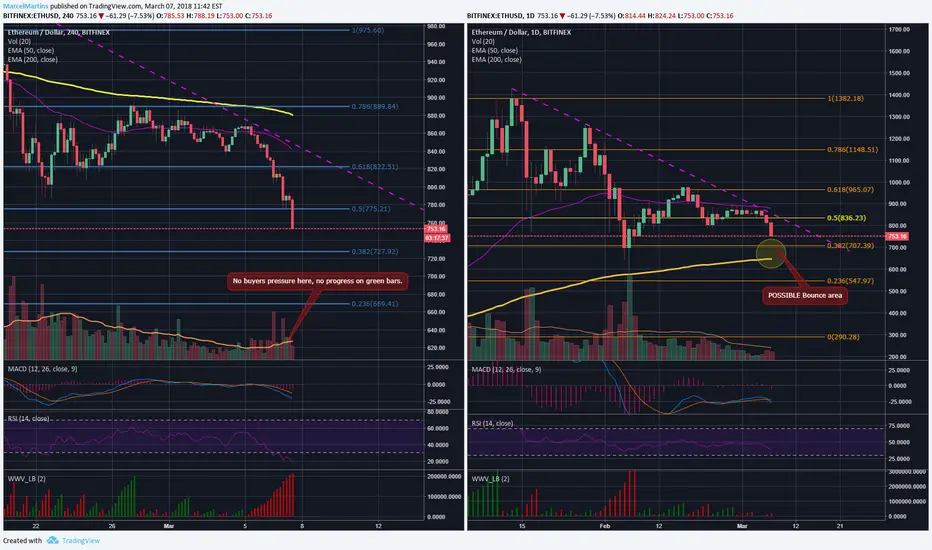
On our 4h chart we can see ETH is already below our 50 and 200ema, MACD is bearish and the sell pressure is too strong.
RSI is way oversold so we might see a little pullback on the next couple hours.
The 0.5 fibo level is gone and now we're going to 0.382 level.
On the daily chart, taking a look on our indicators, MACD is bearish, RSI still has room to decline and the sell pressure is too strong also.
Even if we look at the price action itself, it doesnt look good, no volume green bars without any progress and strong red bars with good volume and progress downwards.
What now?
Now we need to wait for a possible bounce on the circle area, the 0.382 fibo level and the 200 ema SHOULD provide support and ETH might bounce on this area.
IF ETH break down these levels we will reach lower levels, which will be good to do position trade since this coin will for most likely recover for medium and long term.
If we get a bounce from this area, a breakout on the downtrend (pink dotted) will be a confirmation of the end of this bear momentum for ETH.
This is NOT a trade signal and is here just for educational purposes.
Lets take a look on ETHUSD , which is bleeding a lot these days.
On our 4h chart we can see ETH is already below our 50 and 200ema, MACD is bearish and the sell pressure is too strong.
RSI is way oversold so we might see a little pullback on the next couple hours.
The 0.5 fibo level is gone and now we're going to 0.382 level.
On the daily chart, taking a look on our indicators, MACD is bearish, RSI still has room to decline and the sell pressure is too strong also.
Even if we look at the price action itself, it doesnt look good, no volume green bars without any progress and strong red bars with good volume and progress downwards.
What now?
Now we need to wait for a possible bounce on the circle area, the 0.382 fibo level and the 200 ema SHOULD provide support and ETH might bounce on this area.
IF ETH break down these levels we will reach lower levels, which will be good to do position trade since this coin will for most likely recover for medium and long term.
If we get a bounce from this area, a breakout on the downtrend (pink dotted) will be a confirmation of the end of this bear momentum for ETH.
This is NOT a trade signal and is here just for educational purposes.
Note
The price rejected the daily 200EMA, now we may see a bounce, lets keep a closer look on the lower timeframes price action. On the other hand, a break and close down below the 200ema (daily) will invalidate any bullish action.
Disclaimer
The information and publications are not meant to be, and do not constitute, financial, investment, trading, or other types of advice or recommendations supplied or endorsed by TradingView. Read more in the Terms of Use.
Disclaimer
The information and publications are not meant to be, and do not constitute, financial, investment, trading, or other types of advice or recommendations supplied or endorsed by TradingView. Read more in the Terms of Use.