Is consolidation finally over? It very well could be. If you take a peak at the ETHBTC chart, we may have hit bottom. :)

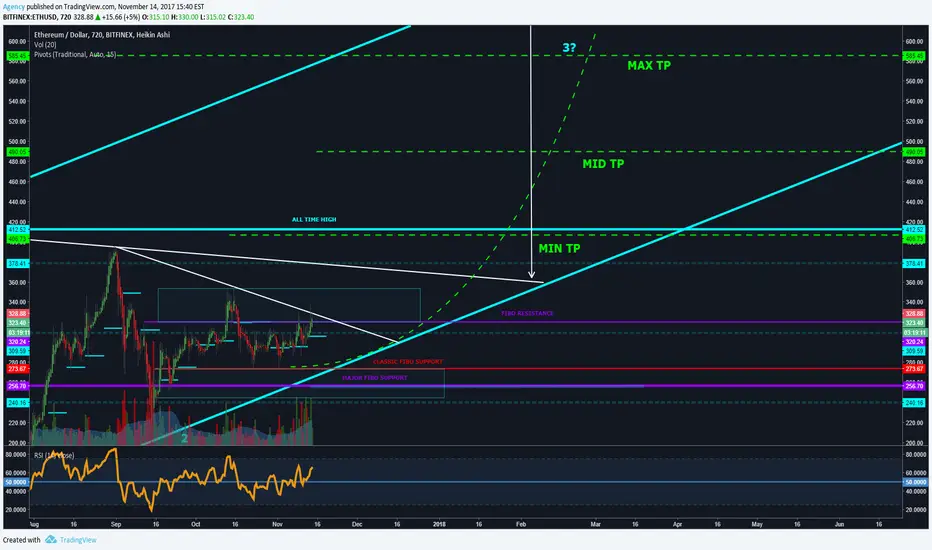
As for the ETHUSD chart, one more test of the uptrend line may be in the cards, followed by an explosive move to the upside. There will be plenty of opportunities to get involved. Targets to the upside include a MIN TP of $406, a MID TP of $490 and a MAX TP of $585.45. There is also a pattern target higher at $677!
Alternatively, if we puncture the uptrend line and stay there, we have strong supports at $273 and $256.
Cheers and GLWT!
-Erik
Note
Strong resistance ling ahead.Trade closed manually
Will buy back a breakout, will keep ya'll updated.Note
Note
Trade active
oH YEAHNote
XD XD XD we've been waiting for this for soooo long... we are now trading in the pink channel...if we get over a close above the break out (orange line) we will explode to the top of the pink channel!!Trade closed: target reached
MIN TP REACHED. Let's see if we can get the BiiiGG breakout now...Trade closed: target reached
OK...we hit FLAG TP so I'm closing out the rest of my position. The breakout looks...meh. I think we to consolidate:Take note how this pattern developed after 300% gains:
We need a daily close to move higher
Trade active
Look at that hook! It tested the big flag line and broke out again! This is why we place pending buy orders. The thing is, we still need a daily close.
Trade closed manually
I had my trailing stop pretty tight. We fell out of the super super bullish channal. But I can see us consolidate, and then moving up. Look at the ETHBTC chart, it could be a huge move against BTC.Trade active
Another breakout!Note
Trade closed manually
Pink channel is too strong!Note
Note
Note
HIT MID TP! Thats a strong fibo level so we don't buy until we get a close above that on small TFsNote
This is either a really bullish pattern, or a bearish one :PBTC chart looks a little chabby.
Note
fake outNote
Ok, we sold off pretty hard. Now testing the BO level with RSI in the friendly zone. I'm not sure we can recover from this super soon to push new highs. We may need to dip back into the BiG flag and regroup.Related publications
Disclaimer
The information and publications are not meant to be, and do not constitute, financial, investment, trading, or other types of advice or recommendations supplied or endorsed by TradingView. Read more in the Terms of Use.
Related publications
Disclaimer
The information and publications are not meant to be, and do not constitute, financial, investment, trading, or other types of advice or recommendations supplied or endorsed by TradingView. Read more in the Terms of Use.