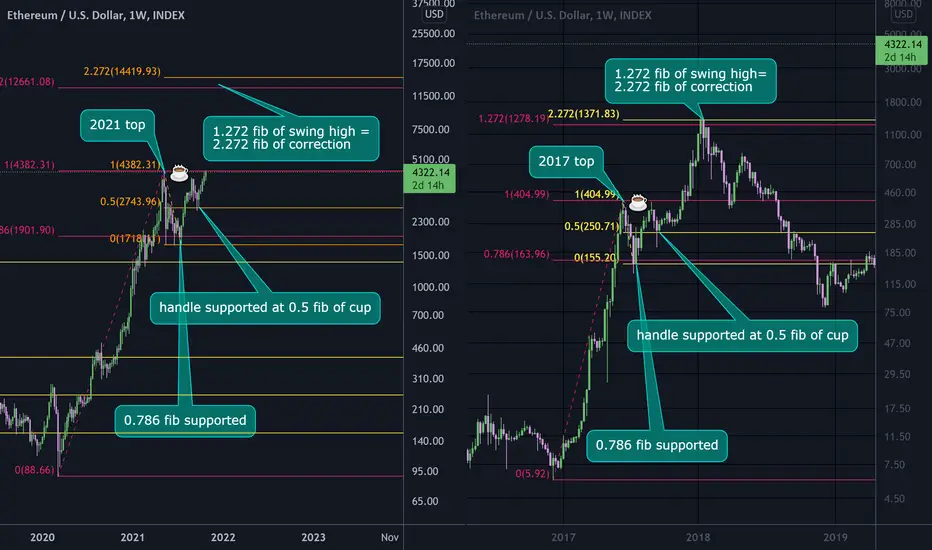
#ETHUSD
Weekly Log chart
Comparison of the 2017 and 2021 bull markets.
similarities:
- small correction to 0.786 fib.
- formed a cup and handle in small correction that handle supported at 0.5 fib level.
differences:
- 2017 correction took longer, that I think now people are more interested.
If price close a weekly candle above previous high, and follow history just like 2017, price will touch $12600 and even $14000.
Related publications
Disclaimer
The information and publications are not meant to be, and do not constitute, financial, investment, trading, or other types of advice or recommendations supplied or endorsed by TradingView. Read more in the Terms of Use.
Related publications
Disclaimer
The information and publications are not meant to be, and do not constitute, financial, investment, trading, or other types of advice or recommendations supplied or endorsed by TradingView. Read more in the Terms of Use.