This Ethereum (ETH/USD) 4-hour chart presents a **bullish setup**. Let’s break it down:
**Chart Overview:**
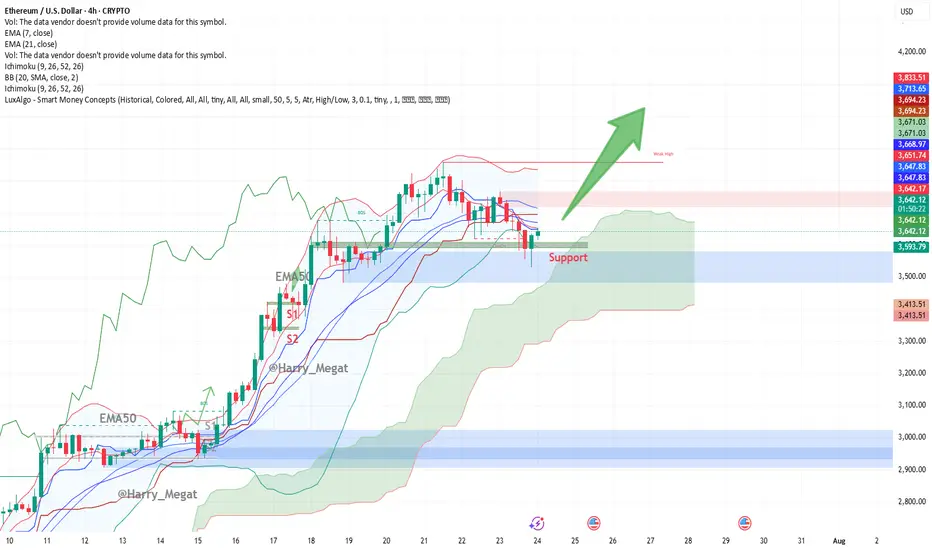
* **Price at the time of chart:** \~\$3,650
* **Support Zone:** \~\$3,615–3,630 (highlighted in green box)
* **Indicators:**
* **EMA 7 (Red):** \~\$3,653.87
* **EMA 21 (Blue):** \~\$3,669.75
* **Bullish Signal:** Large upward green arrow suggests expectation of a breakout rally from current support.
**Technical Analysis:**
**1. Bullish Bounce at Support**
* ETH tested the **horizontal support zone** multiple times, showing strong demand.
* The recent candle shows a **wick rejection** from the support zone — indicating buyer strength.
**2. Moving Averages**
* Price is trying to reclaim above the **EMA7**, with EMA21 nearby (\~\$3,670).
* A **bullish crossover** or strong candle close above both EMAs could confirm upside continuation.
**3. Structure**
* Previous resistance (\~\$3,615) has turned into **new support** — a classic bullish flip.
* The large green arrow projects a **potential breakout move**, targeting higher highs possibly above **\$3,750+**, then **\$3,900+**.
**Trade Setup Idea:**
| Type | Entry | Stop Loss | Take Profit 1 | Take Profit 2 |
| Long | \$3,655–3,660 | Below \$3,600 | \$3,750 | \$3,900+ |
**Watch Out For:**
* Rejection near EMA21 (\$3,670)
* False breakout if volume is weak
* Macro risk or sudden BTC movement dragging ETH
**Conclusion:**
The chart signals a **bullish bias** if ETH maintains above the support zone and reclaims both EMAs. A clean break above \~\$3,670–3,700 could spark further upside toward \$3,900+.

**Chart Overview:**
* **Price at the time of chart:** \~\$3,650
* **Support Zone:** \~\$3,615–3,630 (highlighted in green box)
* **Indicators:**
* **EMA 7 (Red):** \~\$3,653.87
* **EMA 21 (Blue):** \~\$3,669.75
* **Bullish Signal:** Large upward green arrow suggests expectation of a breakout rally from current support.
**Technical Analysis:**
**1. Bullish Bounce at Support**
* ETH tested the **horizontal support zone** multiple times, showing strong demand.
* The recent candle shows a **wick rejection** from the support zone — indicating buyer strength.
**2. Moving Averages**
* Price is trying to reclaim above the **EMA7**, with EMA21 nearby (\~\$3,670).
* A **bullish crossover** or strong candle close above both EMAs could confirm upside continuation.
**3. Structure**
* Previous resistance (\~\$3,615) has turned into **new support** — a classic bullish flip.
* The large green arrow projects a **potential breakout move**, targeting higher highs possibly above **\$3,750+**, then **\$3,900+**.
**Trade Setup Idea:**
| Type | Entry | Stop Loss | Take Profit 1 | Take Profit 2 |
| Long | \$3,655–3,660 | Below \$3,600 | \$3,750 | \$3,900+ |
**Watch Out For:**
* Rejection near EMA21 (\$3,670)
* False breakout if volume is weak
* Macro risk or sudden BTC movement dragging ETH
**Conclusion:**
The chart signals a **bullish bias** if ETH maintains above the support zone and reclaims both EMAs. A clean break above \~\$3,670–3,700 could spark further upside toward \$3,900+.
Trade active
*ETH/USD Bullish Trade – Update***Trade Idea Recap**
| Entry Zone | Stop Loss | TP1 | TP2 |
| --------------- | ------------- | ------- | -------- |
| \$3,655–\$3,660 | Below \$3,600 | \$3,750 | \$3,900+ |
**What Happened**
* ✅ **Entered around \$3,655**
* ✅ Price surged to **\$3,738**
* 📍 **TP1 (\$3,750)** is **nearly hit**
* ✅ **Bullish breakout confirmed**
* Price above EMA 7 & 21
* Holding above \$3,700 structure
**Next Steps**
* **If holding**: Trail stop-loss to **\$3,670+**
* **Watch for TP1 at \$3,750**, then let ride toward **TP2 \$3,900+**
* **New entries**: Wait for pullback to **\$3,700–\$3,670** or breakout above \$3,750
**Bias**: Bullish continuation toward **\$3,900+** while price holds above \$3,700.
Trade closed: target reached
*ETH/USD Trade Update– FULL WIN***Trade Idea**
* **Type**: Long
* **Entry**: \$3,655–\$3,660
* **Stop Loss**: Below \$3,600
* **Targets**:
* 🎯 **TP1**: \$3,750 ✅
* 🎯 **TP2**: \$3,900+ ✅
**Outcome**
* ETH rallied strongly from the support zone.
* Clean breakout above **EMAs and \$3,670–\$3,700 resistance**.
* Final price hit: **\$3,932** 🔥
---
### 🧠 **Key Success Factors**
* Strong support reaction (\$3,615–\$3,630)
* EMA reclaim & bullish crossover
* Structure flip and momentum follow-through
**Result**: **100% Profitable**
→ Both targets achieved. Clean technical trade.
Disclaimer
The information and publications are not meant to be, and do not constitute, financial, investment, trading, or other types of advice or recommendations supplied or endorsed by TradingView. Read more in the Terms of Use.
Disclaimer
The information and publications are not meant to be, and do not constitute, financial, investment, trading, or other types of advice or recommendations supplied or endorsed by TradingView. Read more in the Terms of Use.