Summary:
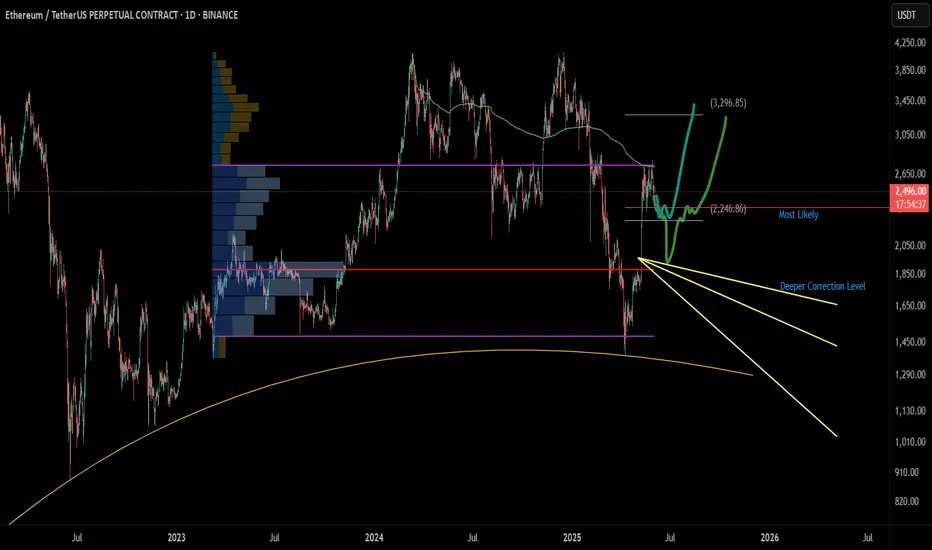
After a strong ~100% rally in ETH, price hit a major resistance zone near $2734.78, triggering a significant sell-off, likely driven by algorithmic profit-taking. Now, the market is poised for a healthy correction before another potential leg up.
📉 What's Next for Ethereum?
🔍 Expecting a Correction of 7% to 25%
Based on technical structure and indicator behavior, ETH is likely to retrace to one of the two key zones:
✅ Primary Buy Zone ("Most Likely"): $2297.20
🔥 Deeper Correction Opportunity: $1779.58
📊 Why This Correction Makes Sense:
Weekly Money Flow Index (MFI) is Dropping:
Algo Profit-Taking is Done:
📈 Potential Upside Targets:
If ETH respects the structure and finds support around $2297 or deeper, we could see a rally toward $3296.85 — a key Fibonacci extension and psychological level.
🧘♂️ Reminder:
No emotional entries. Let the price come to you. Trust the setup and stick to your plan.
📌 Disclaimer: This is not financial advice. Just a breakdown of my trading thesis. Always manage your risk.
After a strong ~100% rally in ETH, price hit a major resistance zone near $2734.78, triggering a significant sell-off, likely driven by algorithmic profit-taking. Now, the market is poised for a healthy correction before another potential leg up.
📉 What's Next for Ethereum?
🔍 Expecting a Correction of 7% to 25%
Based on technical structure and indicator behavior, ETH is likely to retrace to one of the two key zones:
✅ Primary Buy Zone ("Most Likely"): $2297.20
- This zone aligns with previous structure support.
- It’s where the price may form a higher low and resume its upward trend.
- Ideal for opening a swing long with a tight risk-reward ratio.
🔥 Deeper Correction Opportunity: $1779.58
- While less likely, a drop to this level would be a major long opportunity.
- Aligns with historical demand and long-term support levels.
- Also intersects with the yellow trendlines suggesting trend-based support zones.
📊 Why This Correction Makes Sense:
Weekly Money Flow Index (MFI) is Dropping:
- MFI divergence suggests money is flowing out, weakening bullish momentum.
- A trigger wave is forming, often preceding price corrections.
Algo Profit-Taking is Done:
- Smart money likely exited around $2734.78 (highlighted in chart).
- They’ll need to accumulate again at lower levels before the next rally.
📈 Potential Upside Targets:
If ETH respects the structure and finds support around $2297 or deeper, we could see a rally toward $3296.85 — a key Fibonacci extension and psychological level.
🧘♂️ Reminder:
No emotional entries. Let the price come to you. Trust the setup and stick to your plan.
📌 Disclaimer: This is not financial advice. Just a breakdown of my trading thesis. Always manage your risk.
Disclaimer
The information and publications are not meant to be, and do not constitute, financial, investment, trading, or other types of advice or recommendations supplied or endorsed by TradingView. Read more in the Terms of Use.
Disclaimer
The information and publications are not meant to be, and do not constitute, financial, investment, trading, or other types of advice or recommendations supplied or endorsed by TradingView. Read more in the Terms of Use.