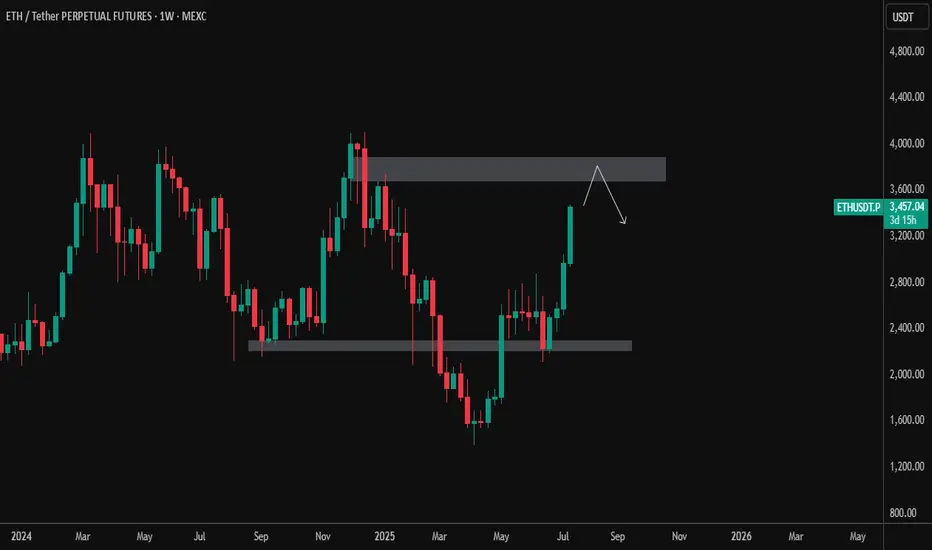
Ethereum has shown a strong bullish push, breaking above the prior consolidation zone between $2,400–$2,600. Price is now approaching a significant weekly supply zone between $3,800–$4,100 — a region that previously acted as a major reversal point.
🔹 Current Price: ~$3,460
🔹 Resistance Zone: $3,800–$4,100
🔹 Support Zone: $2,400–$2,600
📌 Possible Scenarios:
Rejection from resistance: ETH may test the upper supply zone and face selling pressure, triggering a pullback toward the mid-range or support.
Breakout & Close Above $4,100: Would signal strong bullish continuation with potential targets toward new highs.
📉 Watch for: Bearish price action near resistance or a potential lower high forming.
📈 Bullish Bias Confirmed if: Weekly close above $4,100 with volume support.
🧠 Patience is key at major levels. Let price action guide the next move.
Disclaimer
The information and publications are not meant to be, and do not constitute, financial, investment, trading, or other types of advice or recommendations supplied or endorsed by TradingView. Read more in the Terms of Use.
Disclaimer
The information and publications are not meant to be, and do not constitute, financial, investment, trading, or other types of advice or recommendations supplied or endorsed by TradingView. Read more in the Terms of Use.