ETHUSDT – Market Insight & Price Structure
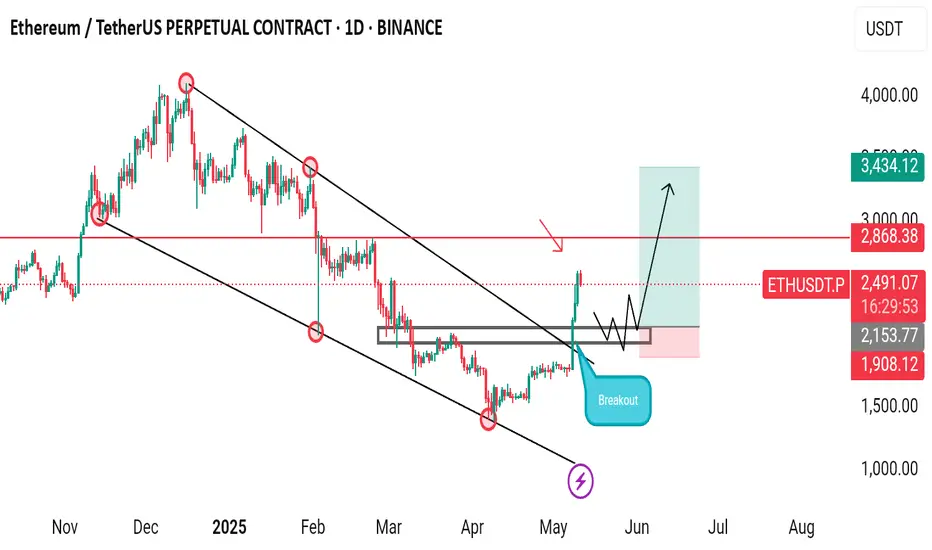
Ethereum has been shaping a falling wedge pattern over the past 2 to 3 months—a structure that typically suggests a bullish reversal. Recently, price action confirmed a breakout above the key resistance zone between $2034 and $2040, along with a clean break of the upper trendline of the wedge. These movements point to a strong bullish signal, suggesting potential continuation to the upside.
Currently, Ethereum is approaching a significant resistance level around $2860. If price reaches this zone, we’ll be watching closely for confirmed reversal signals to consider a potential short/sell setup.
On the other hand, the primary bullish trend trade remains valid near the $2160–$2150 support range. A long position will only be considered upon confirmation, such as a bullish engulfing candlestick pattern, market structure shift (MSS), or other trusted technical signals.
Disclaimer: This is not financial advice. Always do your own research (DYOR).
Join My Telegram Channel For Getting Free Signals and Analysis 👇👇
t.me/fxinsighthub7
t.me/fxinsighthub7
Disclaimer
The information and publications are not meant to be, and do not constitute, financial, investment, trading, or other types of advice or recommendations supplied or endorsed by TradingView. Read more in the Terms of Use.