Overview:
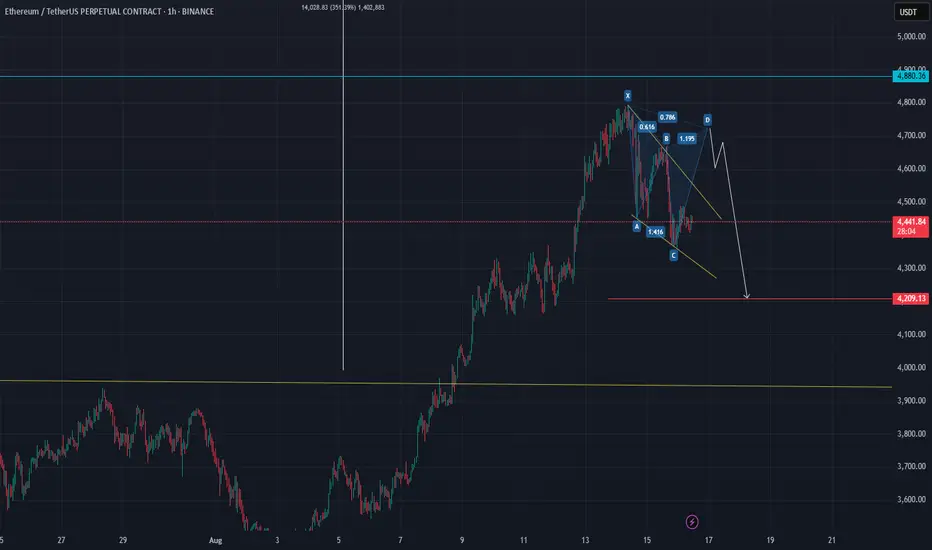
Ethereum is currently showing a corrective pattern after hitting recent highs near $4,880. Price action indicates a potential bearish continuation within a descending channel. The chart highlights a possible ABCD harmonic formation that may lead to further downside movement.
Key Observations:
Current Price: $4,445
Pattern: ABCD correction (potential reversal at D)
Resistance Zones: $4,600 – $4,700
Support Zones / Targets:
Target 1: $4,200
Target 2: $3,900
Target 3: $3,700
Target 4: $3,200
Notes:
Price may attempt a short-term pullback towards the D point before continuing downward.
Watch for confirmation at the descending channel’s upper trendline for potential short entries.
Target levels are based on previous support zones and Fibonacci projections.
Risk management is crucial—set stop-loss above the $4,600–$4,700 resistance area.
Trading Plan:
Consider scaling into short positions on rejection at resistance or after confirming the bearish continuation.
Partial profit-taking at each target zone to manage risk and lock in gains.
Summary:
ETH/USDT is showing early signs of a wave 4 correction in a bearish sequence. Keep an eye on the descending channel and ABCD completion for optimal entry and exit points.
Disclaimer
The information and publications are not meant to be, and do not constitute, financial, investment, trading, or other types of advice or recommendations supplied or endorsed by TradingView. Read more in the Terms of Use.
Disclaimer
The information and publications are not meant to be, and do not constitute, financial, investment, trading, or other types of advice or recommendations supplied or endorsed by TradingView. Read more in the Terms of Use.