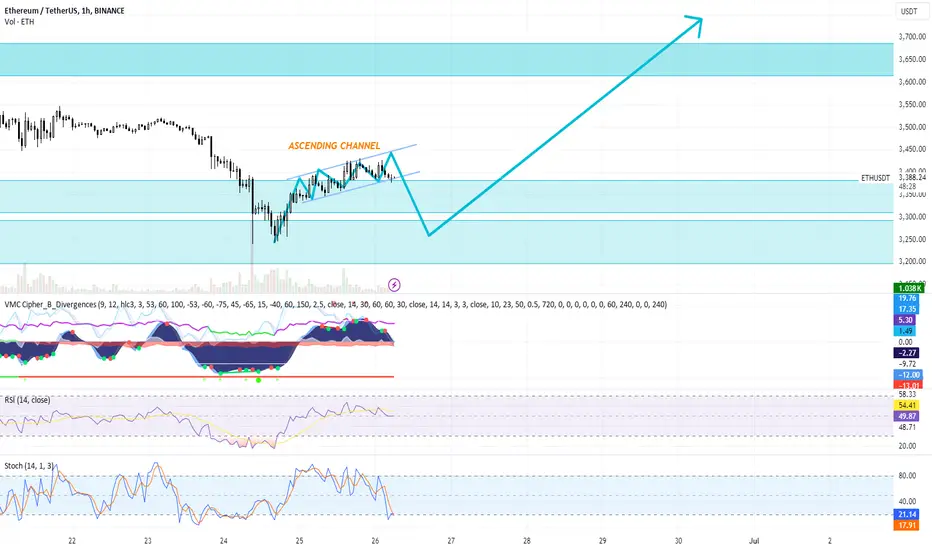
Ascending Channel:
The chart shows Ethereum moving within an ascending channel, which generally indicates a bullish trend. The price recently broke below the ascending channel, suggesting a potential correction.
Support and Resistance Levels:
Support levels are identified around 3,300 and 3,200 USDT.
Resistance levels are around 3,400 and 3,600 USDT.
Indicators:
VMC Cipher B Divergences: Mixed signals with some bearish and bullish divergences. The current state suggests a bearish divergence.
RSI (Relative Strength Index): Currently at 49.51, indicating a neutral position. No clear overbought or oversold condition.
Stochastic RSI: Shows an oversold condition with a value of 17.22, which might indicate a potential buying opportunity soon.
Trading Plan:
Intraday Trading:
Entry: Look for long positions if the price shows a strong support bounce around 3,300 USDT.
Exit: Target the first resistance level around 3,400 USDT.
Stop Loss: Place a stop loss slightly below the support level at 3,280 USDT.
Strategy: Monitor shorter time frames (e.g., 15-minute chart) for bullish candlestick patterns or momentum indicators turning positive before entering.
Scalping:
Entry: Enter long positions at support levels identified on the 5-minute chart, especially if there is a double bottom or strong reversal pattern.
Exit: Quick profits at minor resistance levels or key moving averages on the same chart.
Stop Loss: Tight stop loss just below the immediate support levels, such as 3,290 USDT.
Strategy: Use high-frequency trades to capitalize on small price movements, considering both support and resistance levels.
Swing Trading:
Entry: Consider entering long positions if the price bounces from 3,300 USDT support level, confirming a reversal.
Exit: Aim for the resistance level around 3,600 USDT.
Stop Loss: Place a stop loss around 3,200 USDT to protect against deeper corrections.
Strategy: Hold the position for a few days to a week, allowing the trade to develop. Use the daily chart to identify entry and exit points.
My advice:
Long Position: Favor long positions at current levels, given the oversold conditions on the Stochastic RSI and the presence of support around 3,300 USDT. Watch for a confirmed reversal signal before entering.
Short Position: Consider short positions if the price fails to hold the 3,300 USDT level and breaks lower, aiming for the next support at 3,200 USDT.
Risk Management: Always use stop losses to manage risk and protect capital. Adjust stop loss levels according to the volatility and trade timeframe.
Overall, the current technical setup suggests a cautious long bias, waiting for confirmation of support holding and potential reversal signals before entering trades.
Disclaimer
The information and publications are not meant to be, and do not constitute, financial, investment, trading, or other types of advice or recommendations supplied or endorsed by TradingView. Read more in the Terms of Use.
Disclaimer
The information and publications are not meant to be, and do not constitute, financial, investment, trading, or other types of advice or recommendations supplied or endorsed by TradingView. Read more in the Terms of Use.