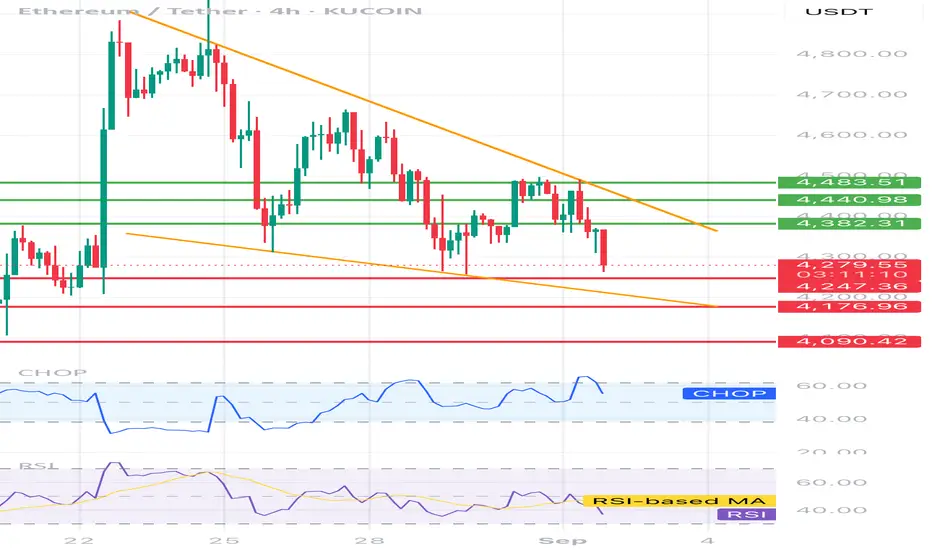
1. Trend
• The price is in the downward channel (designated orange lines).
• The last candle tests the lower restriction of the channel → Possible reflections or breaking down.
2. Horizers of support and resistance
• resistance (green lines):
• 4,440 USDT
• 4,382 USDT
• Support (red lines):
• 4,268 USDT (currently tested)
• 4,247 USDT
• 4,176 USDT
• 4 090 USDT (stronger support)
If 4,268 is pierced and maintained below, a further exit can be around 4 176–4 090.
3. RSI (Relative Strength Index)
• Currently RSI oscillates below 50 → Bear advantage.
• There is still a strong sale signal (<30), so theoretically there is still a space to decline.
4. Chop (Choppiness Index)
• The indicator shows a fairly "jagged" market → no strong trend, but from the current context of more bear pressure.
⸻
📊 Scenarios:
• Bull (reflection): If the price stays above 4 268 and reflects from the bottom line of the channel → possible traffic towards 4 382 and 4 440.
• Bear (continuation of declines): closing the candle 4h below 4,268 → a signal for further drop to 4 176 and even 4 090.
Disclaimer
The information and publications are not meant to be, and do not constitute, financial, investment, trading, or other types of advice or recommendations supplied or endorsed by TradingView. Read more in the Terms of Use.
Disclaimer
The information and publications are not meant to be, and do not constitute, financial, investment, trading, or other types of advice or recommendations supplied or endorsed by TradingView. Read more in the Terms of Use.