Summary
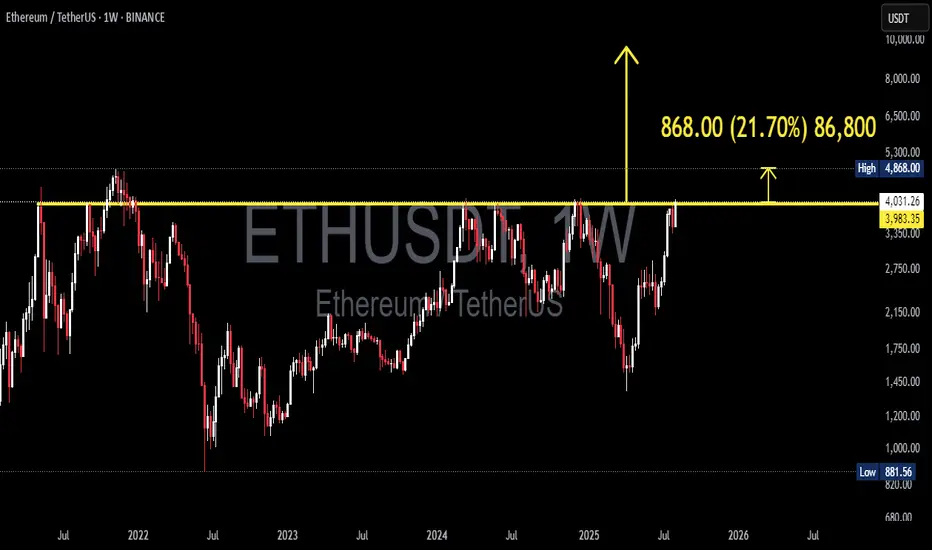
The weekly chart shows Ethereum testing a multi-year horizontal resistance zone around $3.9k–$4.1k, a level repeatedly tested since 2021. The measured move on the chart projects a potential target of $4,868 — about +$868 or ~21–22% upside — if a confirmed breakout occurs on the weekly timeframe.
---
Technical Analysis (based on chart)
Timeframe: Weekly (1W). The current test is highly significant due to the higher timeframe, with medium- to long-term implications.
Key Levels:
Major resistance zone: ≈ $3,950 – $4,100 (yellow line).
Breakout target: $4,868 (≈ +$868 or ~+21–22% from the breakout zone).
First support if rejected: ≈ $3,300 – $3,600. Stronger support at $2,100 – $2,750.
Price Action: Price has made multiple peaks at this zone (multiple tops), signaling strong supply. However, recent higher lows suggest growing bullish momentum — if a breakout occurs.
Pattern: Multi-year horizontal resistance. Possible outcomes:
Rejection: Acts as a triple-top / horizontal supply zone.
Breakout: Transitions into a range breakout setup with measured target.
---
Bullish Scenario (confirmation needed)
1. Confirmation signal: Weekly close above $4.0k zone with strong follow-through in the next week.
2. Entry strategies:
Conservative: Wait for a retest (resistance → support) before entering, with stop below retest (~$3.7k).
Aggressive: Enter on breakout, stop below breakout candle low.
3. Target: First target ~$4,868 (measured move). If momentum persists, higher targets may be reached.
4. Invalidation: Weekly close back below $3.7k–3.8k after breakout.
---
Bearish Scenario (if rejection occurs)
1. Confirmation signal: Bearish rejection candle (pin bar / engulfing) on weekly + no breakout close.
2. Entry strategies: Short or take profit on longs after confirmed rejection; ideally backed by bearish follow-through next week.
3. Target downside: First support $3.3k–3.6k; stronger drop could retest $2.1k–2.8k zone.
4. Invalidation: Weekly close back above $4.1k with strong bullish volume.
---
Risk Management & Notes
Weekly close is key — avoid reacting solely to intraday wicks.
Volume matters: No volume = higher risk of false breakout.
Position sizing: Keep risk controlled (e.g., 1–2% per trade), stops in logical zones.
Multi-timeframe check: Use daily chart for precise entries and watch for orderflow/news catalysts.
---
Pattern Notes
Multiple Tops / Horizontal Supply: Sellers have consistently defended this level.
Ascending pressure: Higher lows into resistance can increase breakout probability.
Measured Move: Distance from breakout zone to target is about $868 — matching the chart’s projection.
---
Hashtags
#ETH #ETHUSDT #Ethereum #Crypto #Breakout #Resistance #WeeklyChart #CryptoAnalysis #TechnicalAnalysis
✅ Get Free Signals! Join Our Telegram Channel Here: t.me/TheCryptoNuclear
✅ Twitter: twitter.com/crypto_nuclear
✅ Join Bybit : partner.bybit.com/b/nuclearvip
✅ Benefits : Lifetime Trading Fee Discount -50%
✅ Twitter: twitter.com/crypto_nuclear
✅ Join Bybit : partner.bybit.com/b/nuclearvip
✅ Benefits : Lifetime Trading Fee Discount -50%
Disclaimer
The information and publications are not meant to be, and do not constitute, financial, investment, trading, or other types of advice or recommendations supplied or endorsed by TradingView. Read more in the Terms of Use.