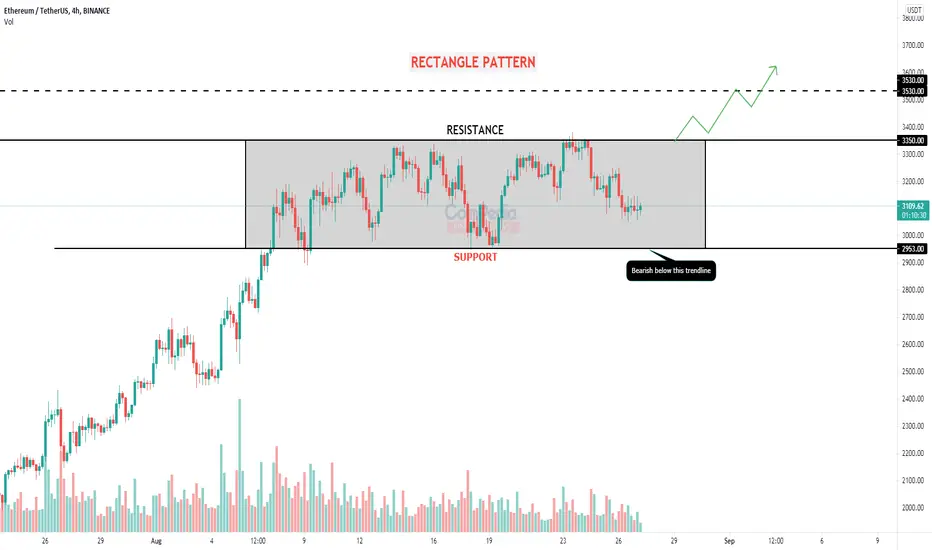
* Ethereum in 4H time frame forms a Rectangle pattern chart pattern.
* A rectangle pattern appears when the price bonds between two parallel trend-lines opposite to each other, where the lower trend-line works as support and the upper trend-line as resistance.
* Rectangle pattern is a trend continuation pattern.
* In order to continue the bull run Ethereum needs to break the resistance.
* Ethereum is bearish below the support.
Note
Breakout of the resistanceTrade closed: target reached
Disclaimer
The information and publications are not meant to be, and do not constitute, financial, investment, trading, or other types of advice or recommendations supplied or endorsed by TradingView. Read more in the Terms of Use.
Disclaimer
The information and publications are not meant to be, and do not constitute, financial, investment, trading, or other types of advice or recommendations supplied or endorsed by TradingView. Read more in the Terms of Use.