The price is rewriting its local ATH and pushing for a breakout toward a new all-time high.
However… the chart still looks like crap.
How long can this kind of growth last? Let’s break it down:
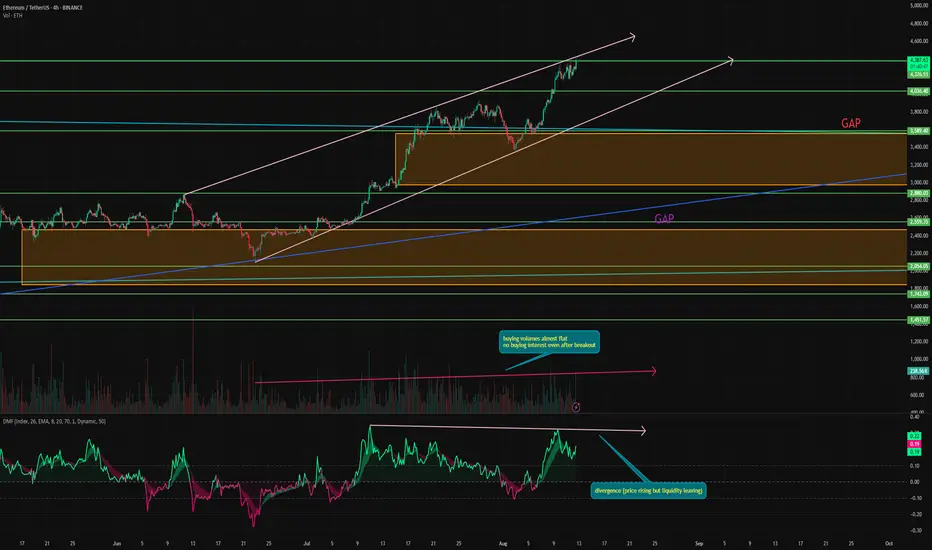
➡️ First thing you notice — almost flat buying volume for the last two months. The price is climbing, but there’s practically no buying volume behind it. Historically, real breakouts to new highs are accompanied by massive volume spikes and strong volatility.
ETH, on the other hand, is just cruising up like a chill guy. That doesn’t mean there’s huge demand — it just means nobody’s in a rush to sell.
➡️ Money Flow — even worse. The indicator shows a divergence with price. These current levels were reached while liquidity was actually flowing out of ETH and positions were being closed. This only confirms that interest in the asset is still declining.
➡️ Along the way, two large gaps have formed — at $3556–2981 and $2474–1851. And as we all know, in 99% of cases, gaps get filled sooner or later.
➡️ Price is also still moving inside an ascending channel and is currently testing the upper boundary — right at the major resistance of $4377.
📌 Conclusion:
Right now, market sentiment on ETH is insanely bullish. People are already talking about $10,000 like it’s around the corner. But the chart doesn’t look genuinely impressive — similar to what we saw with Bitcoin last year.
In my view, even $5,000 seems like a distant dream at this point. And let’s not forget — we’ve had an unreal bullish summer, which is extremely rare for crypto. Do you really think this rally will just keep going in September? And in October? And that bear markets are gone forever?
Yeah… not so fast 😁
However… the chart still looks like crap.
How long can this kind of growth last? Let’s break it down:
➡️ First thing you notice — almost flat buying volume for the last two months. The price is climbing, but there’s practically no buying volume behind it. Historically, real breakouts to new highs are accompanied by massive volume spikes and strong volatility.
ETH, on the other hand, is just cruising up like a chill guy. That doesn’t mean there’s huge demand — it just means nobody’s in a rush to sell.
➡️ Money Flow — even worse. The indicator shows a divergence with price. These current levels were reached while liquidity was actually flowing out of ETH and positions were being closed. This only confirms that interest in the asset is still declining.
➡️ Along the way, two large gaps have formed — at $3556–2981 and $2474–1851. And as we all know, in 99% of cases, gaps get filled sooner or later.
➡️ Price is also still moving inside an ascending channel and is currently testing the upper boundary — right at the major resistance of $4377.
📌 Conclusion:
Right now, market sentiment on ETH is insanely bullish. People are already talking about $10,000 like it’s around the corner. But the chart doesn’t look genuinely impressive — similar to what we saw with Bitcoin last year.
In my view, even $5,000 seems like a distant dream at this point. And let’s not forget — we’ve had an unreal bullish summer, which is extremely rare for crypto. Do you really think this rally will just keep going in September? And in October? And that bear markets are gone forever?
Yeah… not so fast 😁
Disclaimer
The information and publications are not meant to be, and do not constitute, financial, investment, trading, or other types of advice or recommendations supplied or endorsed by TradingView. Read more in the Terms of Use.
Disclaimer
The information and publications are not meant to be, and do not constitute, financial, investment, trading, or other types of advice or recommendations supplied or endorsed by TradingView. Read more in the Terms of Use.