In general, if we look at the weekly TF, we can see the Bearish divergence, which has already worked itself out and the price showed a strong bullish reversal, but for 4 weeks we have been observing a weak sideways trend.
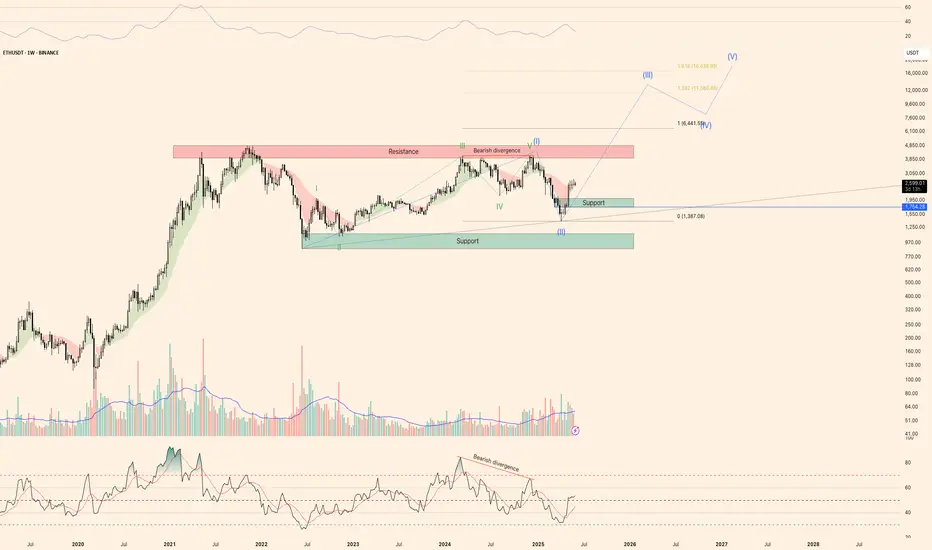
We can draw a trend line along the two bottom points. It is important to note that the level of $1,754 is the key level and if it is broken, we can forget about the growth and wait for the fall to the support zone. The local support zone should be in the range of $2,023-$1,754, in case of correction this range should be protected before the subsequent growth.
If we interpret the movement from June 2022 to December 2024, we have 5 rising waves, the 3rd wave was really slow, but still the rules of 5 waves were not broken. So there is a chance that the price is now in the second wave and we are really waiting for the 3rd long wave in the form of bullrun on ETH, given the length of the first wave, we may see a rise above 10k on ETH.
Global resistance is in the $3,950-$4,860 range
Also, given that the top of wave 5 is only 0.4% higher than the top of wave 3, depending on the exchange, we can also suggest other options for the development of events
One alternative is the ABCDE triangle, this is a long triangle of 4 years. Wave B could end either at the peak on March 11, 2024 or at the peak on December 9, 2024.

In this case we have yet to see a decline before a sharp rise
We can draw a trend line along the two bottom points. It is important to note that the level of $1,754 is the key level and if it is broken, we can forget about the growth and wait for the fall to the support zone. The local support zone should be in the range of $2,023-$1,754, in case of correction this range should be protected before the subsequent growth.
If we interpret the movement from June 2022 to December 2024, we have 5 rising waves, the 3rd wave was really slow, but still the rules of 5 waves were not broken. So there is a chance that the price is now in the second wave and we are really waiting for the 3rd long wave in the form of bullrun on ETH, given the length of the first wave, we may see a rise above 10k on ETH.
Global resistance is in the $3,950-$4,860 range
Also, given that the top of wave 5 is only 0.4% higher than the top of wave 3, depending on the exchange, we can also suggest other options for the development of events
One alternative is the ABCDE triangle, this is a long triangle of 4 years. Wave B could end either at the peak on March 11, 2024 or at the peak on December 9, 2024.
In this case we have yet to see a decline before a sharp rise
✅My Telegram
t.me/trading_mura
t.me/trading_mura
Disclaimer
The information and publications are not meant to be, and do not constitute, financial, investment, trading, or other types of advice or recommendations supplied or endorsed by TradingView. Read more in the Terms of Use.
✅My Telegram
t.me/trading_mura
t.me/trading_mura
Disclaimer
The information and publications are not meant to be, and do not constitute, financial, investment, trading, or other types of advice or recommendations supplied or endorsed by TradingView. Read more in the Terms of Use.