📊 Pattern Overview: Head and Shoulders
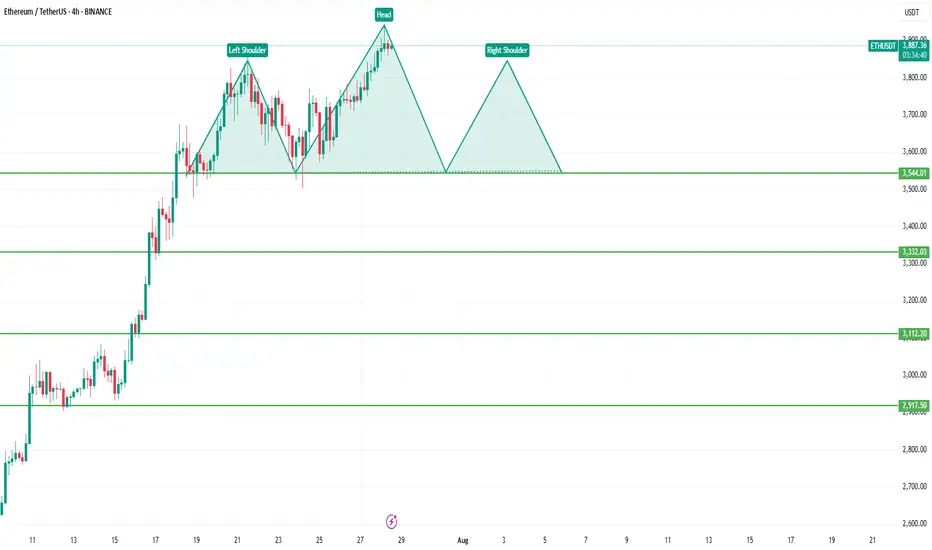
Left Shoulder: Formed around July 24th, marked by a high near $3,800 followed by a retracement.
Head: A higher peak on July 27th, topping out near $3,888, then pulling back again.
Right Shoulder: Currently anticipated, projected to form around the same height as the left shoulder, with a potential completion near $3,800 before another decline.
Neckline: Flat support line around $3,544, acting as the crucial level that, if broken, confirms the pattern.
🧠 Interpretation
The Head and Shoulders is generally interpreted as a trend reversal pattern. In this context, Ethereum has been in a strong uptrend, but the pattern signals a potential topping out and shift toward a bearish phase.
If ETH breaks below the neckline at $3,544 with volume confirmation, it would signal that bulls are losing control, and sellers may take over.
📉 Bearish Breakdown Target
The theoretical downside target can be calculated by measuring the distance from the Head to the Neckline and projecting it downward from the neckline:
Head peak: ~$3,888
Neckline: ~$3,544
Height: ~$344
📌 Target after breakdown:
$3,544 - $344 = $3,200 (approx.), with interim support levels around:
$3,332 (horizontal support)
$3,112
$2,917
These levels might act as pause points or bounce zones if the breakdown unfolds.
🟢 Invalidation Scenario
If Ethereum invalidates the pattern by:
Breaking above the Head level ($3,888) and holding
Sustaining higher highs with strong volume
Then the bearish thesis would be invalidated, and bulls may aim for continuation toward $4,000+ levels.
🧩 Strategic Takeaways
Aggressive traders might short the neckline break at $3,544, with stops just above the right shoulder (~$3,800).
Conservative traders may wait for a retest of the neckline post-breakdown.
Risk management is key, especially in crypto markets, which are known for head fakes and false breakouts.
⏳ Final Thought
This setup doesn't guarantee a drop—it merely increases the probability of a reversal. Watch for volume on the neckline break and monitor how price reacts at key support levels.
DYOR before taking a trade
Disclaimer
The information and publications are not meant to be, and do not constitute, financial, investment, trading, or other types of advice or recommendations supplied or endorsed by TradingView. Read more in the Terms of Use.
Disclaimer
The information and publications are not meant to be, and do not constitute, financial, investment, trading, or other types of advice or recommendations supplied or endorsed by TradingView. Read more in the Terms of Use.