Hello everyone, let's take a look at the ETH to USDT chart over the 4 hour timeframe.
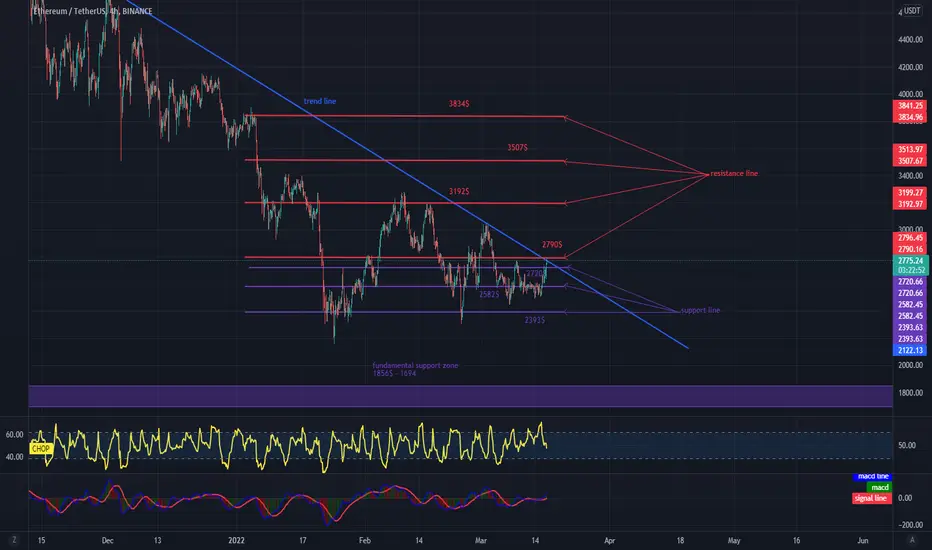
Let's start by marking the downtrend line as you can see that the price is breaking above this line.
Now let's move on to the support line as you can see the first support is around $ 2,720 which is currently based on price, however if the current support is broken the next support is $ 2,582 and $ 2,393.
Looking the other way, it's also worth highlighting the resistance points that price has to overcome and we can see that the first resistance is $ 2,790, the next resistance is $ 3,192, and the next is $ 3,507 and $ 3,834.
It's worth paying attention to the CHOP indicator, which shows that despite the last move we still have some energy.
Disclaimer
The information and publications are not meant to be, and do not constitute, financial, investment, trading, or other types of advice or recommendations supplied or endorsed by TradingView. Read more in the Terms of Use.
Disclaimer
The information and publications are not meant to be, and do not constitute, financial, investment, trading, or other types of advice or recommendations supplied or endorsed by TradingView. Read more in the Terms of Use.