ETH/USDT – Multi-Degree Terminal Advance: Daily Wave ⑤ of C Inside Weekly Wave C (Ending Diagonal)
1️⃣ Higher-Timeframe Context (Weekly)
ETH has been unfolding a large corrective A-B-C structure from the all-time high.
The current rally is Wave C of that correction.
Structural note: On the weekly, Wave 4 overlaps Wave 1 → violates standard impulse rules → the entire Wave C is taking the form of an Ending Diagonal.
Why this matters:
Ending diagonals appear in terminal positions (Wave 5 of an impulse or Wave C of a correction).
They often end with a throw-over above the upper trendline, followed by sharp and deep reversals.
2️⃣ Intermediate-Timeframe Context (Daily)
On the daily, we are in:
Wave ⑤ of daily Wave C.
That daily Wave C is also the final leg of weekly Wave C.
Implication:
Two degrees (daily & weekly) are scheduled to terminate together → high-probability major turning point.
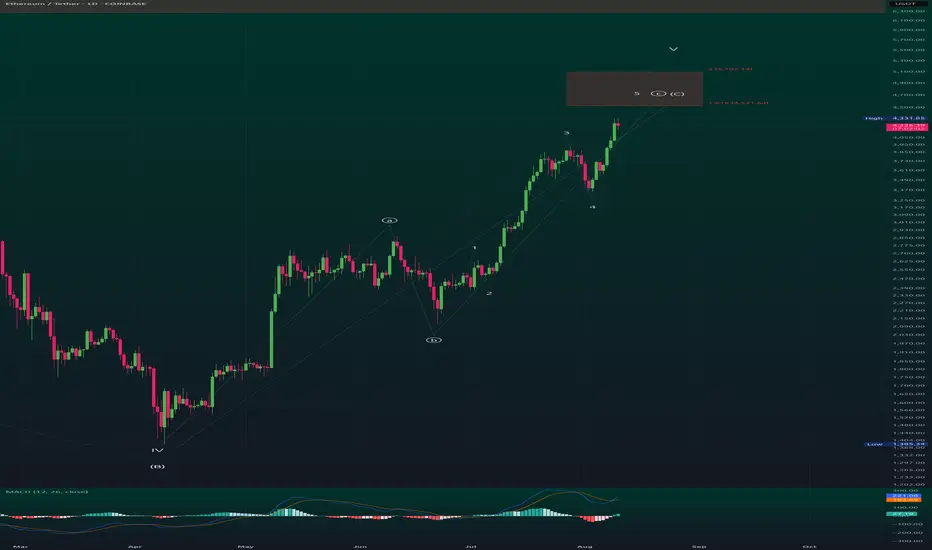
3️⃣ Structure & Internal Wave Count
From the IV(B) low in April, ETH has advanced in five overlapping sub-waves:
Wave 1 – steady breakout leg.
Wave 2 – shallow pullback.
Wave 3 – strongest rally to date.
Wave 4 – pullback overlapping Wave 1 territory → confirms diagonal.
Wave 5 – ongoing final push into target zone.
Internals of each wave show a-b-c formations, consistent with diagonal rules.
4️⃣ Fibonacci Target Confluence
Anchor: IV(B) low → Wave 3 high → Wave 4 low
1.618 extension: $4,531 → first resistance.
2.000 extension: $5,102 → primary target.
Upper wedge projection / throw-over: $5,500–$5,650.
These levels also align with weekly fib projections for Wave C → creating a multi-timeframe resistance cluster.
5️⃣ Momentum & Divergence
MACD (Daily): Histogram making lower highs while price makes higher highs → early bearish divergence.
RSI (Daily & Weekly): Approaching overbought with flattening momentum → consistent with terminal phases.
Volume: Gradual contraction during the advance; watch for final spike on throw-over.
6️⃣ Scenarios
A) Terminal Top Scenario (Base Case)
Price completes Wave ⑤ of C inside the $4,531–$5,102 box.
Possible throw-over into $5,500–$5,650 on ETF hype.
Followed by swift rejection back inside wedge → break of Wave-4 low confirms top.
Targets after confirmation:
First: Wedge base / 0.382 retrace (~$3,800).
Next: 0.5 retrace (~$3,500).
Extended: Origin of diagonal (~$2,900).
B) ETF Extension Scenario
Price consolidates above $5,100 and pushes toward $5,500–$5,650.
Still part of Wave ⑤, just a stretched terminal before reversal.
Same confirmation rules: break of Wave-4 low validates reversal.
7️⃣ Invalidation & Risk Levels
Bearish invalidation: Break of Wave-4 low = high-probability top.
Bullish invalidation: Sustained breakout + consolidation above $5,650 would require re-evaluating the diagonal scenario.
8️⃣ Trade Plan (Non-Advice)
Aggressive fade: Short into $4,531–$5,102, add near $5,500–$5,650 if reached, stop above wedge throw-over.
Conservative: Wait for daily close back inside wedge and break of Wave-4 low, then short pullbacks.
Positioning note: Size down in diagonals — volatility spikes at turns.
9️⃣ Key Chart Annotations for Publishing
Wedge trendlines from Wave-II(B) low to Wave-IV(B) low.
Label 1–2–3–4–5 (with a-b-c internals) on daily.
Highlight $4,531, $5,102, and $5,500–$5,650 zones.
Mark Wave-4 low and wedge base with "Top Confirmed Below Here".
Add MACD/RSI divergence notes in top-right.
📌 Summary
ETH is in the final stages of a multi-degree ending diagonal:
Daily Wave ⑤ of C inside Weekly Wave C.
Both degrees likely terminate in $4,531–$5,102, with throw-over potential to $5,500–$5,650.
Once confirmed, expect a fast, deep retrace — this is a terminal pattern with macro top potential.
1️⃣ Higher-Timeframe Context (Weekly)
ETH has been unfolding a large corrective A-B-C structure from the all-time high.
The current rally is Wave C of that correction.
Structural note: On the weekly, Wave 4 overlaps Wave 1 → violates standard impulse rules → the entire Wave C is taking the form of an Ending Diagonal.
Why this matters:
Ending diagonals appear in terminal positions (Wave 5 of an impulse or Wave C of a correction).
They often end with a throw-over above the upper trendline, followed by sharp and deep reversals.
2️⃣ Intermediate-Timeframe Context (Daily)
On the daily, we are in:
Wave ⑤ of daily Wave C.
That daily Wave C is also the final leg of weekly Wave C.
Implication:
Two degrees (daily & weekly) are scheduled to terminate together → high-probability major turning point.
3️⃣ Structure & Internal Wave Count
From the IV(B) low in April, ETH has advanced in five overlapping sub-waves:
Wave 1 – steady breakout leg.
Wave 2 – shallow pullback.
Wave 3 – strongest rally to date.
Wave 4 – pullback overlapping Wave 1 territory → confirms diagonal.
Wave 5 – ongoing final push into target zone.
Internals of each wave show a-b-c formations, consistent with diagonal rules.
4️⃣ Fibonacci Target Confluence
Anchor: IV(B) low → Wave 3 high → Wave 4 low
1.618 extension: $4,531 → first resistance.
2.000 extension: $5,102 → primary target.
Upper wedge projection / throw-over: $5,500–$5,650.
These levels also align with weekly fib projections for Wave C → creating a multi-timeframe resistance cluster.
5️⃣ Momentum & Divergence
MACD (Daily): Histogram making lower highs while price makes higher highs → early bearish divergence.
RSI (Daily & Weekly): Approaching overbought with flattening momentum → consistent with terminal phases.
Volume: Gradual contraction during the advance; watch for final spike on throw-over.
6️⃣ Scenarios
A) Terminal Top Scenario (Base Case)
Price completes Wave ⑤ of C inside the $4,531–$5,102 box.
Possible throw-over into $5,500–$5,650 on ETF hype.
Followed by swift rejection back inside wedge → break of Wave-4 low confirms top.
Targets after confirmation:
First: Wedge base / 0.382 retrace (~$3,800).
Next: 0.5 retrace (~$3,500).
Extended: Origin of diagonal (~$2,900).
B) ETF Extension Scenario
Price consolidates above $5,100 and pushes toward $5,500–$5,650.
Still part of Wave ⑤, just a stretched terminal before reversal.
Same confirmation rules: break of Wave-4 low validates reversal.
7️⃣ Invalidation & Risk Levels
Bearish invalidation: Break of Wave-4 low = high-probability top.
Bullish invalidation: Sustained breakout + consolidation above $5,650 would require re-evaluating the diagonal scenario.
8️⃣ Trade Plan (Non-Advice)
Aggressive fade: Short into $4,531–$5,102, add near $5,500–$5,650 if reached, stop above wedge throw-over.
Conservative: Wait for daily close back inside wedge and break of Wave-4 low, then short pullbacks.
Positioning note: Size down in diagonals — volatility spikes at turns.
9️⃣ Key Chart Annotations for Publishing
Wedge trendlines from Wave-II(B) low to Wave-IV(B) low.
Label 1–2–3–4–5 (with a-b-c internals) on daily.
Highlight $4,531, $5,102, and $5,500–$5,650 zones.
Mark Wave-4 low and wedge base with "Top Confirmed Below Here".
Add MACD/RSI divergence notes in top-right.
📌 Summary
ETH is in the final stages of a multi-degree ending diagonal:
Daily Wave ⑤ of C inside Weekly Wave C.
Both degrees likely terminate in $4,531–$5,102, with throw-over potential to $5,500–$5,650.
Once confirmed, expect a fast, deep retrace — this is a terminal pattern with macro top potential.
Related publications
Disclaimer
The information and publications are not meant to be, and do not constitute, financial, investment, trading, or other types of advice or recommendations supplied or endorsed by TradingView. Read more in the Terms of Use.
Related publications
Disclaimer
The information and publications are not meant to be, and do not constitute, financial, investment, trading, or other types of advice or recommendations supplied or endorsed by TradingView. Read more in the Terms of Use.