Unlike Bitcoin, Ethereum did not rise much in these few days.
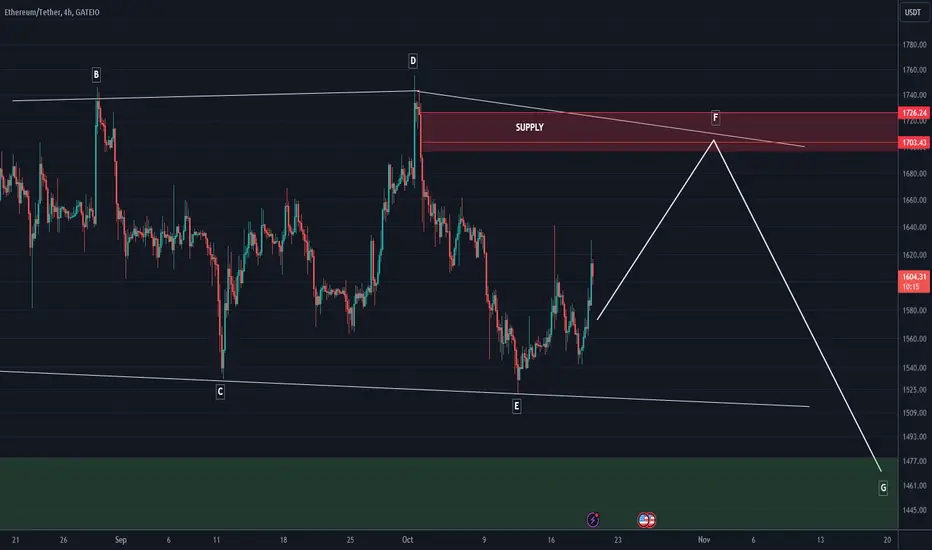
Examining the chart of Ethereum, we can see that a diametric can be identified that we are now in the F wave and then move down for the G wave and the $1400 channel.
The red area is our supply area, which can move the price down.
For risk management, please don't forget stop loss and capital management
Comment if you have any questions
Thank You
Trade active
According to the previous analysis, Ethereum rose 8% and hit the specified supply. This supply is strong, be careful🔆To succeed in trading, just enter our Telegram channel:
Free membership: t.me/Behdark_EN
🔷Our Telegram channel has daily spot and futures signals 👉 t.me/Behdark_EN
💎 Exclusive signals are only shared on our Telegram channel
Free membership: t.me/Behdark_EN
🔷Our Telegram channel has daily spot and futures signals 👉 t.me/Behdark_EN
💎 Exclusive signals are only shared on our Telegram channel
Disclaimer
The information and publications are not meant to be, and do not constitute, financial, investment, trading, or other types of advice or recommendations supplied or endorsed by TradingView. Read more in the Terms of Use.
🔆To succeed in trading, just enter our Telegram channel:
Free membership: t.me/Behdark_EN
🔷Our Telegram channel has daily spot and futures signals 👉 t.me/Behdark_EN
💎 Exclusive signals are only shared on our Telegram channel
Free membership: t.me/Behdark_EN
🔷Our Telegram channel has daily spot and futures signals 👉 t.me/Behdark_EN
💎 Exclusive signals are only shared on our Telegram channel
Disclaimer
The information and publications are not meant to be, and do not constitute, financial, investment, trading, or other types of advice or recommendations supplied or endorsed by TradingView. Read more in the Terms of Use.