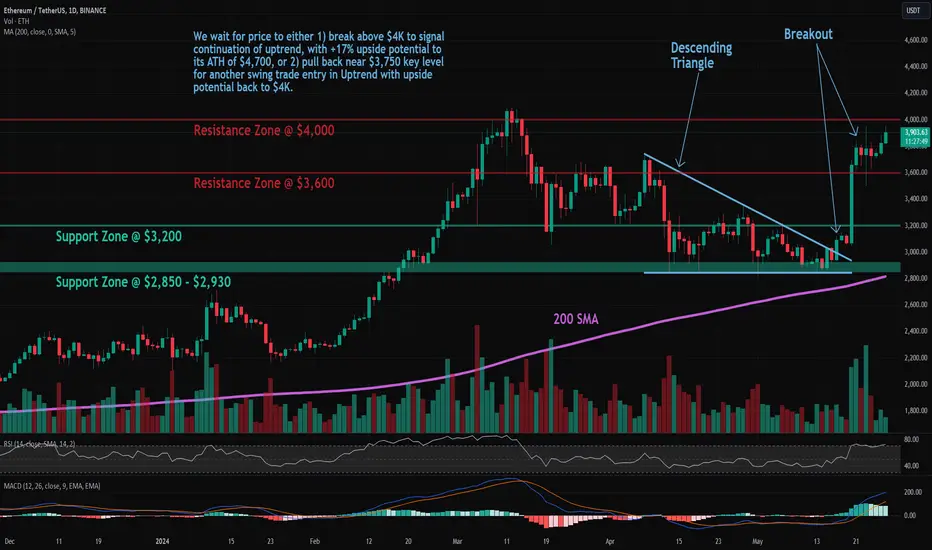
Trade setup: Price is in an Uptrend. Following a bullish breakout from a Descending Triangle pattern, price spiked up 25%, broke above $3,700 resistance and is approaching our near-term target of $4K. It's a bit overbought (RSI ~ 70). Now we look for the right entry opportunity in Uptrend. We wait for price to either 1) break above $4K to signal continuation of uptrend, with +17% upside potential to its ATH of $4,700, or 2) pull back near $3,750 key level for another swing trade entry in Uptrend with upside potential back to $4K. Learn to trade chart patterns in Lesson 8 and set Stop Loss levels in Lesson 9.
Pattern: Price is Approaching Resistance, which is a level where it could pause or reverse its recent advance, at least temporarily. Resistance is often a level where price got rejected in the past, or potentially prior Support level that was broken. (concept known as polarity). Once price breaks above resistance, it can advance higher to the next resistance level. Learn to trade key levels in Lesson 7.
Trend: Short-term trend is Strong Up, Medium-term trend is Strong Up and Long-term trend is Up.
Momentum is Bullish but inflecting. MACD Line is still above MACD Signal Line but momentum may have peaked since MACD Histogram bars are declining, which suggests that momentum could be nearing a downswing. Price is Overbought currently, based on RSI-14 levels (RSI > 70).
Support and Resistance: Nearest Support Zone is $3,200.00, then $2,930.00. Nearest Resistance Zone is $4,000.00, then $4,800.00.
Disclaimer
The information and publications are not meant to be, and do not constitute, financial, investment, trading, or other types of advice or recommendations supplied or endorsed by TradingView. Read more in the Terms of Use.
Disclaimer
The information and publications are not meant to be, and do not constitute, financial, investment, trading, or other types of advice or recommendations supplied or endorsed by TradingView. Read more in the Terms of Use.