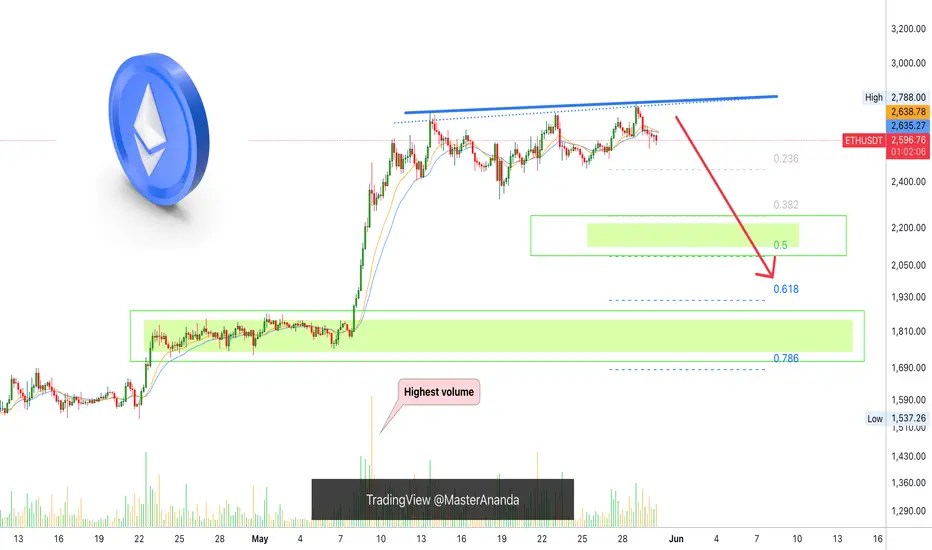
Ethereum can be seen trading below EMA55 on the 4H timeframe. The biggest volume session happened 9-May and it was red. This tells us that there is correction potential after a very strong 101.1% bullish growth wave.
There are mainly three levels to consider for the correction potential after ~100% growth. 0.382, 0.618 & 0.786 Fib. retracement levels. After the test of these levels, whichever one comes last, we can read the chart again and see if Ethereum will continue lower or produce a bullish wave.
One thing is very certain though, after strong growth, there is always a correction/retrace. This is what you are seeing now in this chart. The start of the drop. Taking action is best.
The market moves in waves and will never stop this pattern, it fluctuates. To trade, one buy lows near support; sells high when resistance hit. 100% growth is very strong for the second biggest Cryptocurrency project, the #1 Altcoin.
After a strong bullish wave there is always a correction. After the correction there can be more correction but at some point the market turns. Each chart/pair needs to be considered individually on multiple timeframes to have a better understanding as to what will happen next.
In a single day, based on the news, market conditions can always change. Stay alert!
Namaste.
Trade active
It will recover. This is only a retrace in search of a higher low.We are bullish long-term.
Trade closed: target reached
Won't go lower, it isn't like.If it goes lower, not my business.
We are LONG/bullish until November/December 2025 or March 2026. Whenever the top is in.
🚨 TOP FREE Trades
ETH +1450% · AAVE +1134%
XRP +749% · DOGS +868%
BTC +563% · SOL +658%
t.me/anandatrades/1350
🚨 FREE Analyses & New Results
t.me/masteranandatrades/6499
🚨 PREMIUM LIFETIME (Since 2017)
lamatrades.com
ETH +1450% · AAVE +1134%
XRP +749% · DOGS +868%
BTC +563% · SOL +658%
t.me/anandatrades/1350
🚨 FREE Analyses & New Results
t.me/masteranandatrades/6499
🚨 PREMIUM LIFETIME (Since 2017)
lamatrades.com
Related publications
Disclaimer
The information and publications are not meant to be, and do not constitute, financial, investment, trading, or other types of advice or recommendations supplied or endorsed by TradingView. Read more in the Terms of Use.