Hello, fellow traders!
Follow us to get the latest information quickly.
Have a great day.
-------------------------------------
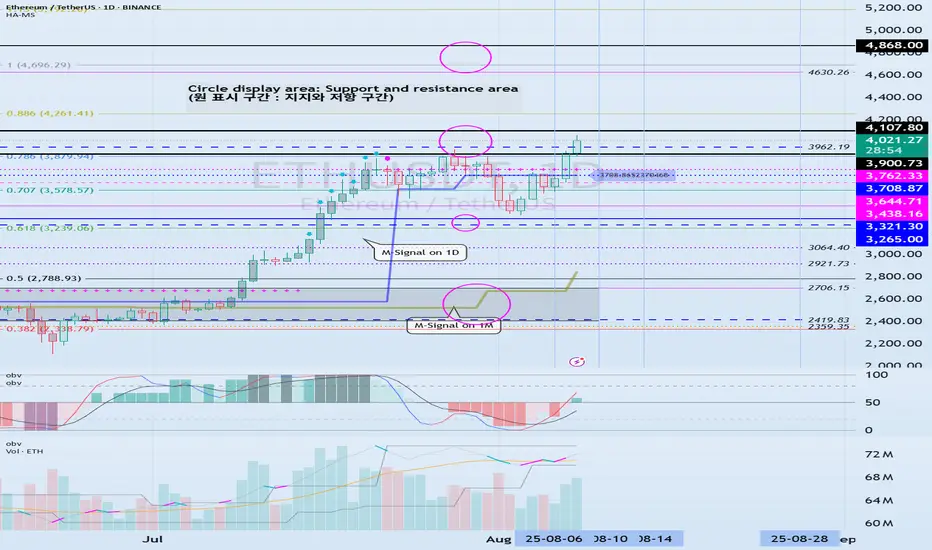
(ETHUSDT 1D chart)
This period of volatility is expected to last from around August 6th to 14th (maximum from August 5th to 15th).
The key question is whether the price can find support and rise above the 3900.73-4107.80 range after this period of volatility.
The next period of volatility is expected to occur around August 28th, so we need to see if the price can hold until then.
If the price declines, we need to check for support around the HA-High ~ DOM (60) range of 3708.87-3762.33.
If not, there's a chance it could fall below 3265.0-3321.30.
-
(1M Chart)
The TC (Trend Check) indicator has risen above 0, suggesting a high possibility of further upside.
Therefore, the key point to watch is whether it can rise above the 4630.26-4868.0 range.
For an uptrend to continue,
- The StochRSI indicator must remain upward with K > D.
(If possible, it's best to avoid K entering the overbought zone.)
- The On-Board Volume (OBV) indicator of the Low Line ~ High Line channel must remain upward.
(If possible, it's best to maintain OBV > OBVEMA.)
- The TC (Trend Check) indicator must remain upward.
(If possible, it should remain above 0.)
If the above conditions are met, the uptrend is likely to continue.
To sustain an uptrend by breaking above key support and resistance levels,
- The StochRSI indicator must remain below the overbought zone and remain above D.
- The On-Board Volume (OBV) indicator of the Low Line ~ High Line channel must rise above the High Line and remain upward.
- The TC (Trend Check) indicator must remain upward. (If possible, it should remain above the 0 point.)
When the above conditions are met, there is a high probability that the price will rise after breaking above important support and resistance levels.
-
Thank you for reading to the end.
I wish you successful trading.
--------------------------------------------------
- Here's an explanation of the big picture.
(3-year bull market, 1-year bear market pattern)

I will explain more in detail when the bear market begins.
------------------------------------------------------
Trade active
#ETHUSDTBTC's volatility period is expected to occur around August 13th (August 12th-14th).
Since ETH will also experience volatility during this period, it's worth monitoring its movements during this period.
The K indicator in the StochRSI indicator is showing a change in slope within the overbought zone, suggesting that upside may be constrained.
Therefore, a test of support is likely around 3900.73-4107.80.
The next resistance level is expected to be around 4630.26-4868.00.
Note
#ETHUSDTThe DOM(60) indicator has formed at 4223.22.
For this level to function properly as support and resistance, it must hold for at least three candlesticks.
Therefore, we should check whether the DOM(60) indicator forms at 4223.22 after a period of volatility.
The formation of the DOM(60) indicator indicates a decline from the high range, increasing the likelihood of further declines.
Currently, the HA-High indicator has formed at 3708.87, so based on the current price, the 3708.87-4223.22 range can be considered a high-boundary range.
Therefore, we should examine whether the 3708.87-4223.22 range provides support and allows for an upward movement.
If support is found around the previous all-time high (ATH) range of 3900.73-4107.80, an upward movement toward the 4630.26-4868.00 range is expected.
This period of volatility for ETH is expected to last until around August 14th (August 13th-15th).
Other content (coins, stocks, etc.) is frequently posted on X.
X에 다른 내용(코인, 주식 등)이 자주 게시.
◆ t.me/readCryptoChannel
[HA-MS Indicator]
bit.ly/3YxHgvN
[OBV Indicator]
bit.ly/4dcyny3
X에 다른 내용(코인, 주식 등)이 자주 게시.
◆ t.me/readCryptoChannel
[HA-MS Indicator]
bit.ly/3YxHgvN
[OBV Indicator]
bit.ly/4dcyny3
Related publications
Disclaimer
The information and publications are not meant to be, and do not constitute, financial, investment, trading, or other types of advice or recommendations supplied or endorsed by TradingView. Read more in the Terms of Use.