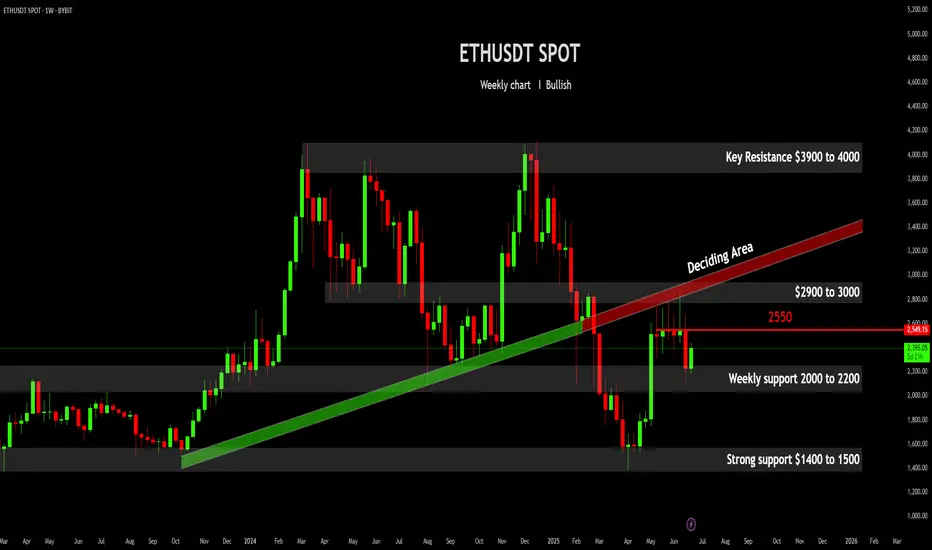
• Current Price Consolidation and Immediate Range: The ETHUSDT price is currently consolidating within a critical immediate range, bounded by the 2000−2200 weekly support below and the 2900−3000 overhead resistance area. This 2000−3000 zone defines the current primary trading boundaries on the weekly timeframe.
• Key Bullish Catalyst at $2550: For the bullish sentiment to gain significant momentum and indicate a potential continuation of the recent upward movement, a decisive weekly close above the $2550 level is paramount. This price point acts as an immediate pivot; successfully clearing and holding above it would suggest a re-energized buying interest targeting the upper bound of the current range.
• Significance of the "Deciding Area": The 2900−3000 region, labeled as a "Deciding Area," represents a crucial resistance confluence. This zone previously served as significant support and the long-term green ascending trendline, which was subsequently broken. A successful retest and breakout above this area would indicate a potential shift in market structure from bearish to bullish, opening the path towards the higher Key Resistance at 3900−4000.
• Critical Support and Downside Risk: Maintaining the 2000−2200 weekly support is essential for bulls. A sustained weekly closure below this level would invalidate the current bullish outlook and likely lead to a retest of the strong demand zone around 1400−1500, signaling a deeper retracement or a renewed bearish trend.
Disclaimer:
The information provided in this chart is for educational and informational purposes only and should not be considered as investment advice. Trading and investing involve substantial risk and are not suitable for every investor. You should carefully consider your financial situation and consult with a financial advisor before making any investment decisions. The creator of this chart does not guarantee any specific outcome or profit and is not responsible for any losses incurred as a result of using this information. Past performance is not indicative of future results. Use this information at your own risk. This chart has been created for my own improvement in Trading and Investment Analysis. Please do your own analysis before any investments.
Disclaimer
The information and publications are not meant to be, and do not constitute, financial, investment, trading, or other types of advice or recommendations supplied or endorsed by TradingView. Read more in the Terms of Use.
Disclaimer
The information and publications are not meant to be, and do not constitute, financial, investment, trading, or other types of advice or recommendations supplied or endorsed by TradingView. Read more in the Terms of Use.