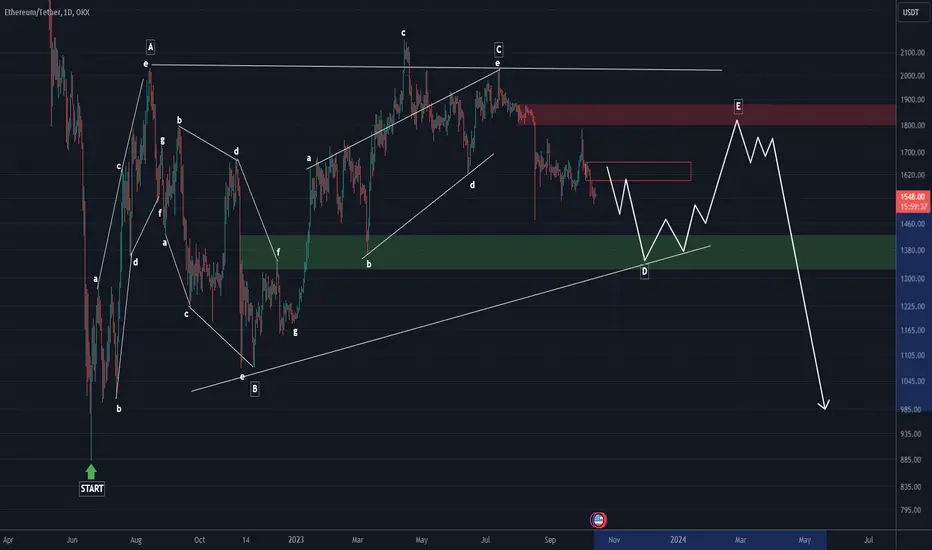
By examining the waves of Ethereum, it seems that the fluctuations of the last 484 days of Ethereum are inside a descending triangle.
What this scenario makes clear to me is that
Now we should be inside the D wave of this triangle.
It seems that after the completion of wave D and E, we will see a heavy drop towards the lower areas.
In order to confirm this scenario, it is necessary to form complete wave D and E, and then in the final wave, i.e. wave E, we will get confirmations of the fall.
I have such a view on Ethereum.
🔆To succeed in trading, just enter our Telegram channel:
Free membership: t.me/Behdark_EN
🔷Our Telegram channel has daily spot and futures signals 👉 t.me/Behdark_EN
💎 Exclusive signals are only shared on our Telegram channel
Free membership: t.me/Behdark_EN
🔷Our Telegram channel has daily spot and futures signals 👉 t.me/Behdark_EN
💎 Exclusive signals are only shared on our Telegram channel
Disclaimer
The information and publications are not meant to be, and do not constitute, financial, investment, trading, or other types of advice or recommendations supplied or endorsed by TradingView. Read more in the Terms of Use.