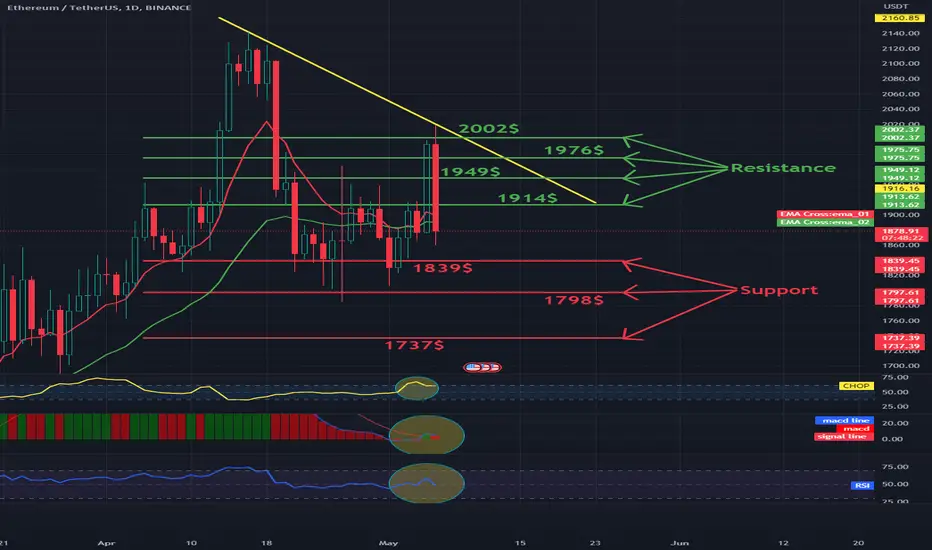
Hello everyone, let's look at the ETH to USDT chart on a single day time frame. As you can see, the price is moving below the local downtrend line.
Let's start with the support line and as you can see the first support in the near future is $ 1839, if the support is broken then the next support is $ 1798 and $ 1737.
Now let's move on to the resistance line, as you can see the first resistance is $ 1914, if you break it the next resistance will be $ 1949, $ 1976 and $ 2002.
Looking at the CHOP indicator, we see that there is a lot of energy, the MACD indicates an uptrend, but we immediately have a strong rebound, while the RSI has all the growth retracted to the middle of the range, but there is a lot of room for the hen to be deepened.
Disclaimer
The information and publications are not meant to be, and do not constitute, financial, investment, trading, or other types of advice or recommendations supplied or endorsed by TradingView. Read more in the Terms of Use.
Disclaimer
The information and publications are not meant to be, and do not constitute, financial, investment, trading, or other types of advice or recommendations supplied or endorsed by TradingView. Read more in the Terms of Use.