🟣 Ethereum Monthly Timeframe Analysis – Large Symmetrical Triangle
📌 Current Situation:
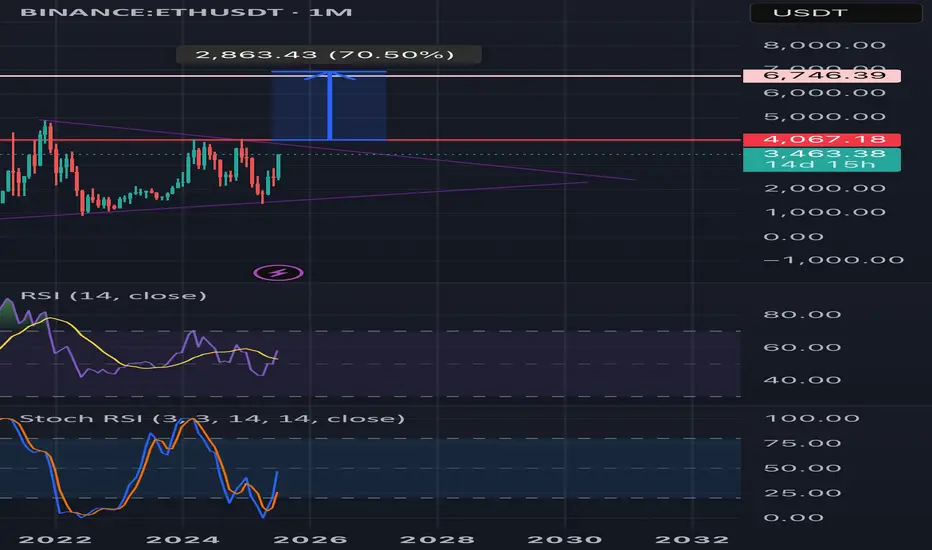
• On the monthly chart (1M), Ethereum (ETH) has formed a large symmetrical triangle pattern.
• This pattern typically signals a major price consolidation before a significant move.
• The descending resistance line connects the 2021 all-time high to recent lower highs.
• The ascending support line is drawn from the 2018 low through the 2022 bottom.
• Price is nearing the apex of the triangle, indicating a breakout is likely soon.
⸻
🔼 Bullish Scenario (Breakout to the Upside):
If ETH breaks above the triangle resistance and confirms the move:
✅ Signs of a Bullish Continuation:
• Strong breakout above the $4,000–$4,500 zone
• Increased volume confirming breakout
• Price holds above resistance-turned-support
🎯 Potential Price Targets by 2027 (based on triangle height & Fibonacci projections):
1. Target 1: $6,800 – $7,500
2. Target 2: $9,000 – $10,000
3. Long-term Target: $12,000 – $15,000 (if macro bull market continues)
⸻
🔽 Bearish Scenario (Fakeout or Breakdown):
If the breakout fails or price breaks down:
• ETH could revisit lower supports around $2,000 or even $1,400
• Bullish momentum delayed until another strong base forms
⸻
🔍 Conclusion:
• This triangle could mark the beginning of a major rally into 2027, especially if supported by fundamentals (e.g., ETF approval, DeFi growth).
• Wait for a confirmed breakout with volume and retest before entering a long-term position.
📌 Current Situation:
• On the monthly chart (1M), Ethereum (ETH) has formed a large symmetrical triangle pattern.
• This pattern typically signals a major price consolidation before a significant move.
• The descending resistance line connects the 2021 all-time high to recent lower highs.
• The ascending support line is drawn from the 2018 low through the 2022 bottom.
• Price is nearing the apex of the triangle, indicating a breakout is likely soon.
⸻
🔼 Bullish Scenario (Breakout to the Upside):
If ETH breaks above the triangle resistance and confirms the move:
✅ Signs of a Bullish Continuation:
• Strong breakout above the $4,000–$4,500 zone
• Increased volume confirming breakout
• Price holds above resistance-turned-support
🎯 Potential Price Targets by 2027 (based on triangle height & Fibonacci projections):
1. Target 1: $6,800 – $7,500
2. Target 2: $9,000 – $10,000
3. Long-term Target: $12,000 – $15,000 (if macro bull market continues)
⸻
🔽 Bearish Scenario (Fakeout or Breakdown):
If the breakout fails or price breaks down:
• ETH could revisit lower supports around $2,000 or even $1,400
• Bullish momentum delayed until another strong base forms
⸻
🔍 Conclusion:
• This triangle could mark the beginning of a major rally into 2027, especially if supported by fundamentals (e.g., ETF approval, DeFi growth).
• Wait for a confirmed breakout with volume and retest before entering a long-term position.
Disclaimer
The information and publications are not meant to be, and do not constitute, financial, investment, trading, or other types of advice or recommendations supplied or endorsed by TradingView. Read more in the Terms of Use.
Disclaimer
The information and publications are not meant to be, and do not constitute, financial, investment, trading, or other types of advice or recommendations supplied or endorsed by TradingView. Read more in the Terms of Use.