Hi traders and investors!
The seller's vector 9-10 reached its mandatory target in the sideways range on the daily TF from the previous review. It's time to update the possible scenarios.
Daily Timeframe Analysis
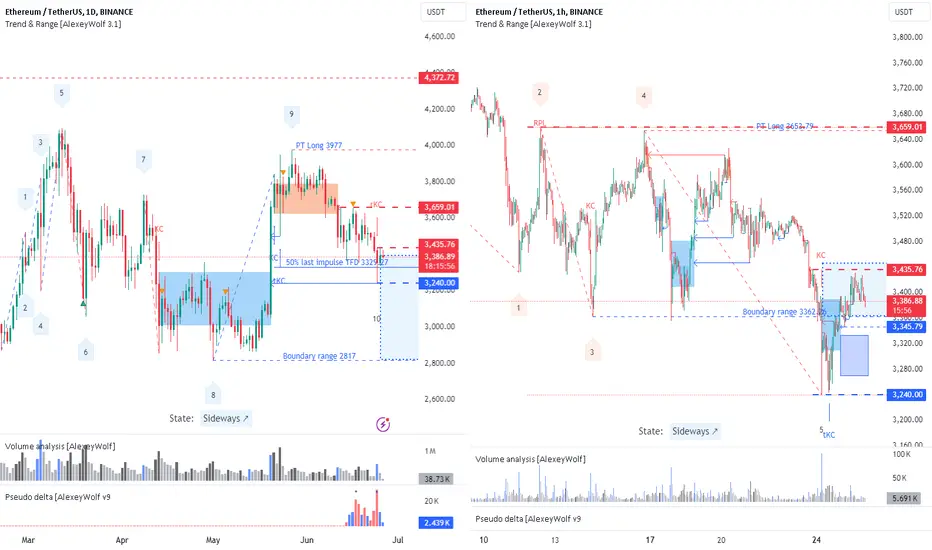
On the daily timeframe, the price has formed a sideways range that began in February 2024. The seller's vector 9-10 reached its mandatory target with a low of 3240, and now the buyer's vector 10-11 is relevant with a potential target of 3977. The first obstacle for the buyer is the high of the last seller's bar at 3435. The price has not yet interacted with this level. Since the price is at the lower boundary of the sideways range on the daily timeframe, it makes sense to start looking for buying opportunities. Let's look at the lower timeframe.
Hourly Timeframe Analysis
On the hourly timeframe, the price has formed a sideways range. The seller's vector 4-5 exited the boundary of the range, and then the buyer absorbed the attacking range boundary candle of the seller, forming a buyer's zone at the end of the seller's vector (blue rectangle on the chart). Currently, the buyer's vector 5-6 is relevant with a potential target of 3653. The price is at the lower boundary of the sideways range on the hourly timeframe, so it makes sense to start looking for buying opportunities.

Buying opportunities
Buying opportunities can be sought from the idea of realizing the buyer's vector 10-11 in the sideways range on the daily timeframe or from the idea of realizing the buyer's vector 5-6 in the sideways range on the hourly timeframe.
From the protection by the buyer of the lower boundary of the sideways range at 3362 on the hourly timeframe.
Please don't forget to like, comment and follow to support me, I really appreciate it!
The seller's vector 9-10 reached its mandatory target in the sideways range on the daily TF from the previous review. It's time to update the possible scenarios.
Daily Timeframe Analysis
On the daily timeframe, the price has formed a sideways range that began in February 2024. The seller's vector 9-10 reached its mandatory target with a low of 3240, and now the buyer's vector 10-11 is relevant with a potential target of 3977. The first obstacle for the buyer is the high of the last seller's bar at 3435. The price has not yet interacted with this level. Since the price is at the lower boundary of the sideways range on the daily timeframe, it makes sense to start looking for buying opportunities. Let's look at the lower timeframe.
Hourly Timeframe Analysis
On the hourly timeframe, the price has formed a sideways range. The seller's vector 4-5 exited the boundary of the range, and then the buyer absorbed the attacking range boundary candle of the seller, forming a buyer's zone at the end of the seller's vector (blue rectangle on the chart). Currently, the buyer's vector 5-6 is relevant with a potential target of 3653. The price is at the lower boundary of the sideways range on the hourly timeframe, so it makes sense to start looking for buying opportunities.
Buying opportunities
Buying opportunities can be sought from the idea of realizing the buyer's vector 10-11 in the sideways range on the daily timeframe or from the idea of realizing the buyer's vector 5-6 in the sideways range on the hourly timeframe.
From the protection by the buyer of the lower boundary of the sideways range at 3362 on the hourly timeframe.
- From the protection by the buyer of the level 3345, which is the test of the seller of the formed buyer's zone at the end of the seller's vector 4-5 on the hourly timeframe.
- From the protection by the buyer of the level 3240, which is the test of the seller of the formed buyer's zone at the base of the buyer's vector 8-9 on the daily timeframe.
- After the buyer absorbs the daily candle of June 24, 2024 on the daily timeframe (conservative strategy).
Please don't forget to like, comment and follow to support me, I really appreciate it!
Wishing you profitable trades!
Clarity on the Chart. Smart Trading Decisions.
No signals. Just clean structure and context t.me/user_friendly_trading
Clarity on the Chart. Smart Trading Decisions.
No signals. Just clean structure and context t.me/user_friendly_trading
Disclaimer
The information and publications are not meant to be, and do not constitute, financial, investment, trading, or other types of advice or recommendations supplied or endorsed by TradingView. Read more in the Terms of Use.